Hi there,
I did a whole-brain cluster-based analysis using the fieldtrip implementation ft_sourcestatistics, and now have 5 significant clusters. Next I want to display them on whole-brain source space if possible. And I was wondering if anyone could help. Also I wonder what the 'c' and 's' represent in the cluster report, as shown in the picture. Thanks!
Best,
Victoria
I want to display them on whole-brain source space if possible
The non-zero values you see on the surface are part of the significant clusters. There is no additional specific display to represent the clusters.
If you have multiple clusters and one to display them separately: click "SEL" and select only the clusters you want to see.
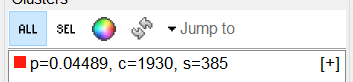
Also I wonder what the 'c' and 's' represent in the cluster report, as shown in the picture.
c = cluster stat
s = cluster size
See tutorial:
https://neuroimage.usc.edu/brainstorm/Tutorials/Statistics#Example_3:_Cluster-based_correction