Hi there,
I did a time-frequency analysis on the whole-brain source space. The output, however, is still a whole brain instead of a typical time-frequency type result. If I click on the output file, there's a 'one-channel' option, and that leads to a TF display. I was wondering what this one-channel option does and if the resulted display is the TF of the whole brain.
Thank you very much for your time!
Best,
Victoria
Hi Victoria,
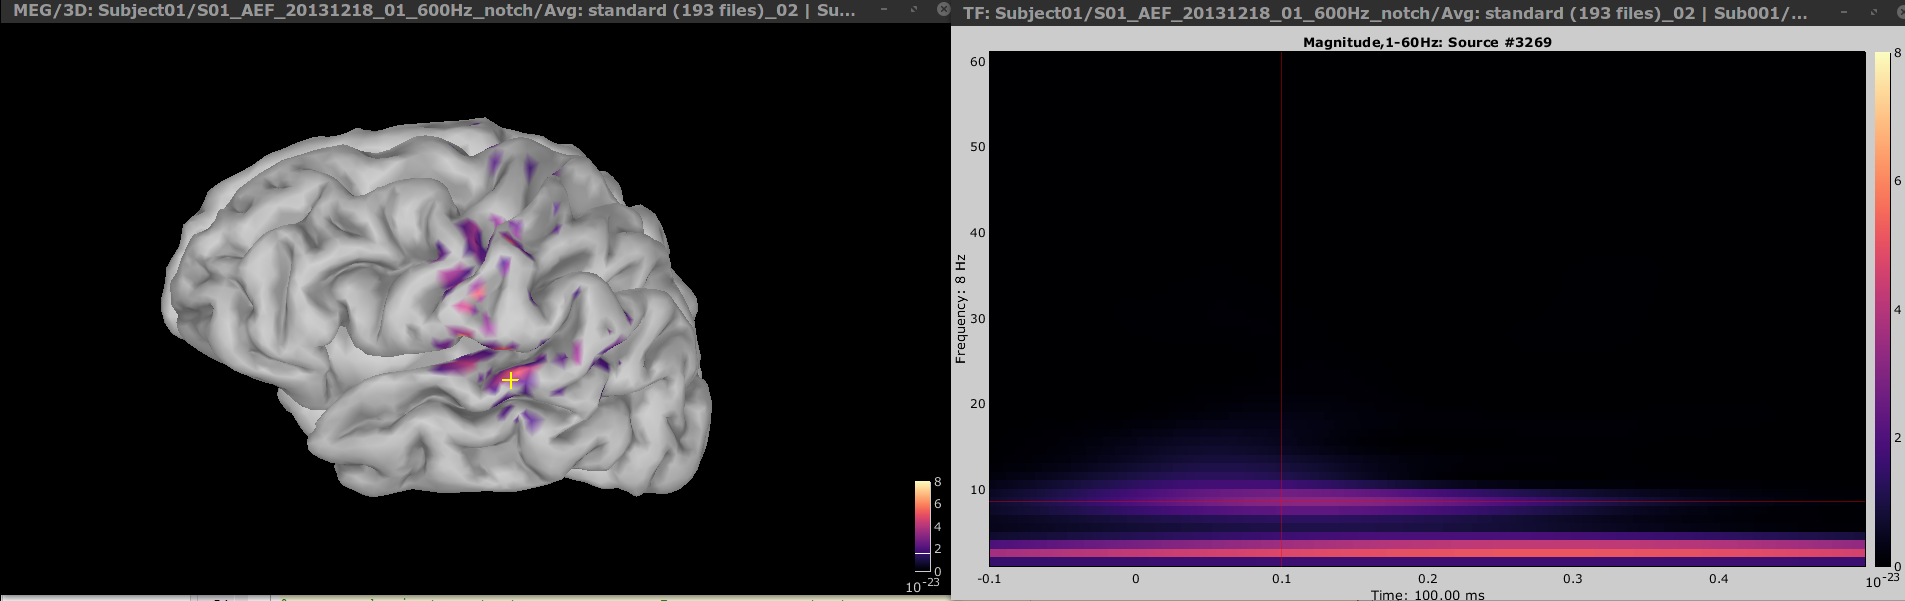
When doing a TF transformation for each source of the brain, the result is a 3D matrix of the size: [nVertices x nTimes x nFrequencies]. Double-clicking the TF file gets the values of the TF transformation for a given Time and given Frequency, controlled in Brainstorm panel. This option is the same as Display on cortex in the context menu.
The One channel context option plots the TF map for one source, which is indicated in the title of the figure. To plot the TF map for a different source, right-click on the cortex and select Source: Time-frequency
As the number of vertices in the order of 1000s, the single source TF representations are not practical to derive meaningful results or interpret the data. A better way is to use regions of interest (or scouts).
See:
EDIT: URLs updated
Best,
Raymundo
Time-frequency decomposition of full brain maps may generate files of several Gb, very long to process and difficult to explore. Depending on your hypothesis, you might be interested at reducing the data dimension, by looking only at one frequency band, or only a few regions of interest (scouts).
Please refer to the updated tutorials, instead of the older ones:
Thank you so much Francois and Raymundo! You've been most helpful!