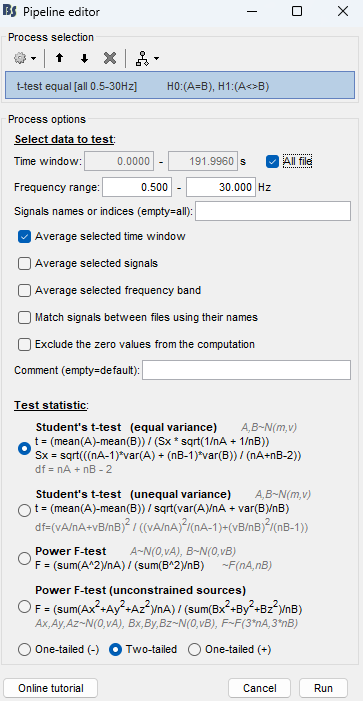
Hi, I need some help regarding group comparison for PSD data at the source level (using scouts). In my case, I am working with resting-state EEG (approximately 200 seconds of recording duration, 19 channels). I performed source reconstruction using minimum norm imaging with sLORETA (constrained). On this source reconstruction, I computed the Power Spectral Density (PSD) for the entire signal using a 5-second window with 50% overlap. For regions of interest, I used the Desikan-Killiany scouts with the scout function set to "mean". Then, I standardized the PSD by calculating the relative power and extracted the Magnitude.
First of all, is this procedure correct, or is there anything I should do differently?
Next, I performed an equal t-test (as shown in the image) to compare the PSD between two independent groups at the source level. However, when I export the results to the MATLAB workspace, I get a matrix of size 15002x1x4 (the 4 corresponds to the 4 frequency bands). What I want is a result of size 68x1x4 (one per scout).
How can I achieve this?
Thank you!
