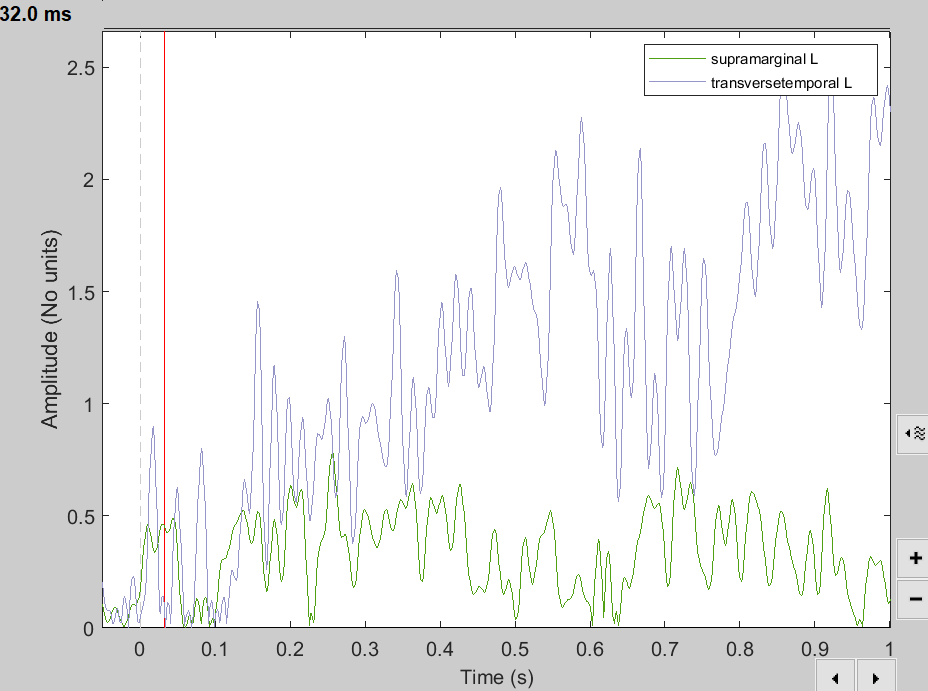
Hi there, I was wondering if there's a way to smooth the displayed waveform of scout time series? My current display is like this, but it'd be great if I could apply a 20ms filter to it for better visualization.
Thank you so much!
Best,
Victoria
Hi there, I was wondering if there's a way to smooth the displayed waveform of scout time series? My current display is like this, but it'd be great if I could apply a 20ms filter to it for better visualization.
Thank you so much!
Best,
Victoria
Hi Victoria,
From my understanding, you want to filter the time series with a moving average filter using a 20ms window, right? If that's the case, for visualization only you can apply low-pass filter at 30Hz in the Filter tab, it will lead to similar results.
See:
https://neuroimage.usc.edu/brainstorm/Tutorials/Averaging#Visual_exploration
Hi Raymundo,
Thanks for your advice! But I find the filter is only effective on individual source files(with the label 'link'), and not on average files. The thing is I want to show the averaged event-related fields of two conditions, I now already have two averaged source files for each condition, but I can't seem to be able to show their smoothed ERF in the ROIs. Thanks!
Best,
Victoria
Hi,
This happens as the visualization filter for the "link" is first applied to the recordings and then filtered recordings are then projected to the source space with the kernel. If you want to smooth the averaged source maps in time, we need to apply explicitly the low-pass filter on the files. See this link on how to perform this:
https://neuroimage.usc.edu/brainstorm/Tutorials/SourceEstimation#Visualization_filters
Alternatively, you can call the process "Extract > Scouts time series" and then filter the signals saved in a new file with the visualization filters.