Hi Francois,
thank you very much for your reply.
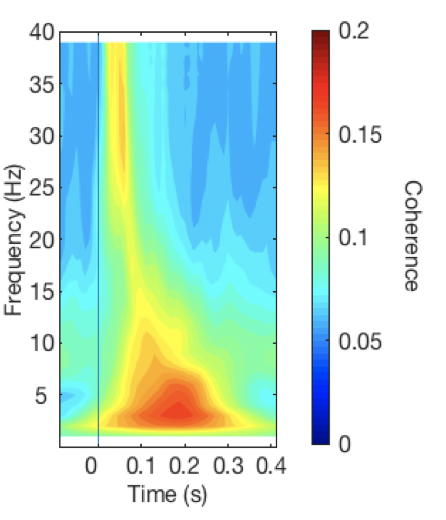
Please find below an example of a coherency (averaged across all electrodes) time by frequency representation I was hoping to produce something similar to in Brainstorm.
In regards to code, with dataSPfreq_coh being my preprocessed data for a single subject:
    % interpolating NaN values due to removal of TMS pulse
    cfg                 = [];
    cfg.prewindow       = 0.995;
    cfg.postwindow      = 0.990;
    cfg.method          = 'linear';
    dataSPfreq_coh          = ft_interpolatenan(cfg, dataSPfreq_coh);

    % freq_coherency analysis
    cfg                 = [];
    cfg.output          = 'powandcsd';
    cfg.method          = 'mtmconvol';
    cfg.foi             = 2:1:40;
    cfg.t_ftimwin       =  2 ./ cfg.foi; %length of the sliding time window in seconds
    cfg.tapsmofrq       = 0.4 *cfg.foi; % smoothing increases with increase in freq_coh
    cfg.toi             = -1:0.01:1;
    dataSPfreq_coh = ft_freqanalysis(cfg, dataSPfreq_coh)

    % Imaginary coherency analysis
    cfg  = [] ;
    cfg.method = 'coh';
    cfg.complex = 'absimag';
    mycoh = ft_connectivityanalysis(cfg, dataSPfreq_coh);
Then with the output structure, I just averaged across the channel domain (something like 1770 pairs) to create a matrix of coherency values by time by frequency, which is what the plot is above.
Best,
Paul