Dear Brainstorm community,
I have preprocessed TMS-EEG data that I have run a 1 x N sensor imaginary coherence analysis with in FieldTrip, and would like to replicate in Brainstorm. I have multiple trials, each being an epoch length of 2 seconds (-1 s before TMS pulse and 1 s after TMS pulse).
From my understanding, for time-frequency analysis there can be no NaNs, so I first used the ft_interpolatenan function to replace the NaN values in the data due to removal of the TMS artifact before importing my .set files into Brainstorm.
Working with a single datafile, I now try to run the imaginary coherency 1 x N process, but when visualizing the results, I am confused as to a few parameters.
-
my time is being listed as [-1.0, 143] s and it states 'Time average' below it. Does this mean the coherence values being displayed are averaged between these two times? When trying to use the arrows to change the time, i can only go to these two values, nothing else. Why is that? Is this related to the calculation of imaginary coherency and my data parameters? How can I get greater time resolution so I can look at how the topoplot changes over time?
-
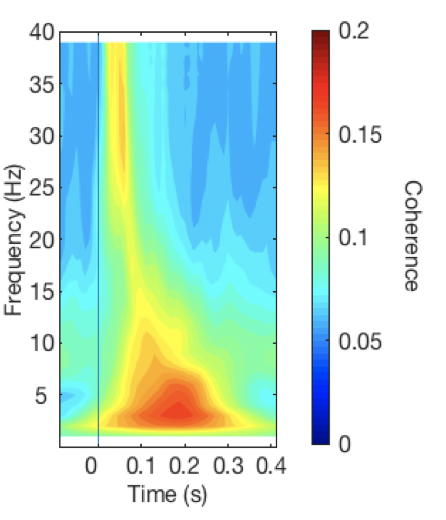
I was hoping to have a sort of coherency map for each electrode, showing the evolution of the coherency for each frequency over time to compare with my results from FieldTrip. How can I get such a map if possible?
I am ultimately hoping to use BrainStorm for source localization of my FieldTrip coherency findings, so thought I would first see if the sensor level findings are similar. Any help would be greatly appreciated.
Best,
Paul