Hi,
I am trying to import my own parcellation into Brainstorm, derived from a mpr T1. My intent is to extract the scouts from my own template in order to, later on, operate an ERP analysis on specific scouts that need to match those derived from an SPM analysis on fMRI data.
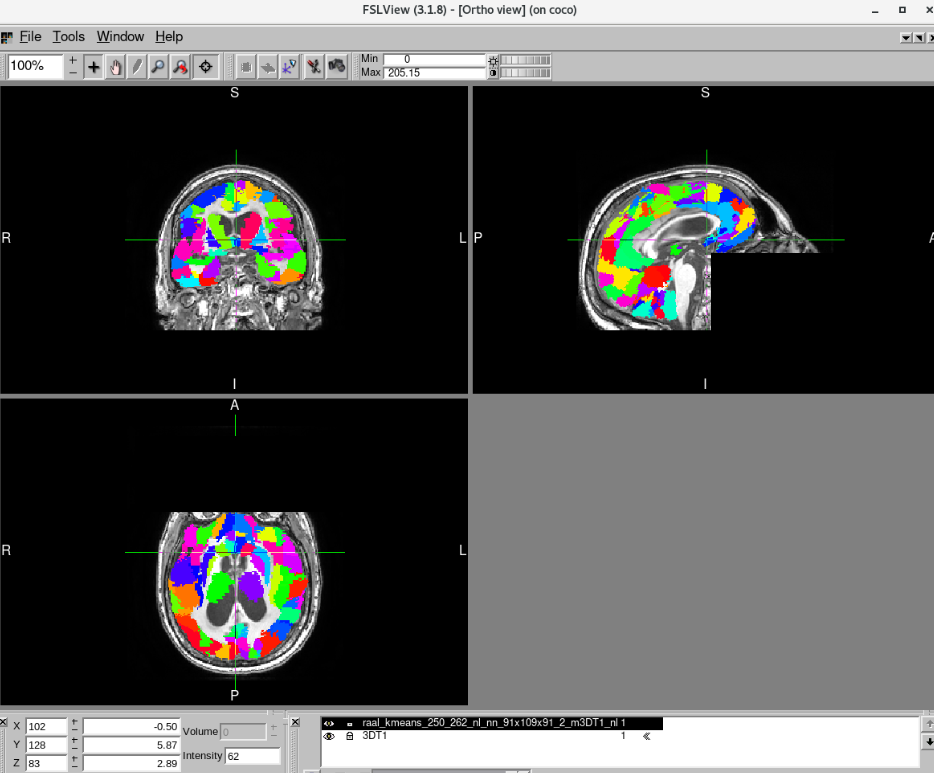
I have the T1 and the parcellation that perfectly overlap if opened with fslview, as the image below shows.
The images have the same dimensions, so I tried importing them into Brainstorm (new subject --> import MRI --> T1.nii). I tried both not to apply the transformation the software suggests when importing the MRI file and applying it, the result does not change. In order to import a parcellation (right click on subject --> ADD mni parcellation --> Import from file), the two images does not match, as the image below makes it clear:
Can someone point me to a solution? I'm kinda new to Brainstorm, I read somewhere that surfaces files are more appropriate in order to manage the scouts, but since I should not work with softwares like FreeSurfer, CAT12 and SPM12 rn, I don't know how to generate the .pial files that are needed.
Unfortunately, importing the atlas as Volume Atlas (subject space) did not resolve the problem (still, it managed to actually kinda match some volumetric ROIs, but many others are discarded as the image below shows).
I actually managed to "trick" it by creating a new subject, importing the volume atlas as the subject's MRI, setting the SCS of the original MRI as the atlas SCS (in order to match subsequently the orientation of the various ROIs to the orientation of the pial surface generated with CAT12), but I don't know how consistent and reliable this procedure is.
I was asking as for this image, it seems your NIfTI file (with the parcels) was imported with the File of TypeAll MRI files (subject space) instead of the Volume atlas (subject space). As the atlases when displayed do not use the colorbar, the color bar is then reserved to the MRI volume (gray).
If that was the case the missing parcels can be explained with the Amplitude slider in the Surface tab of the main Brainstorm window. This is threshold to show the top x% of the values
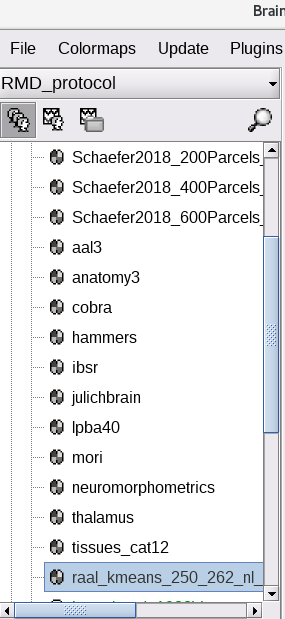
What happen if you double-click this **raal_kmeans_....**Atlas?
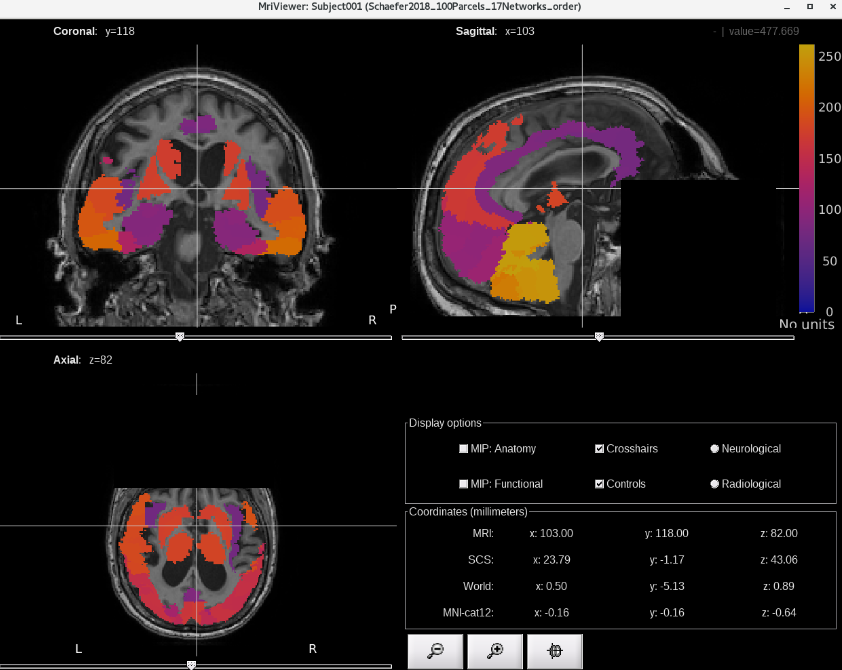
Indeed, changing the ampltitude value of the sliding bar let me see others ROIs, which unfortunately are still slightly misaligned to the MRI file. I tried importing the raal file as All type of MRI, and produced the same results. Actually, if I double click the raal* Atlas, the one imported so far, it produces the same image as before, with the subject MRI underneath and the colored atlas above:
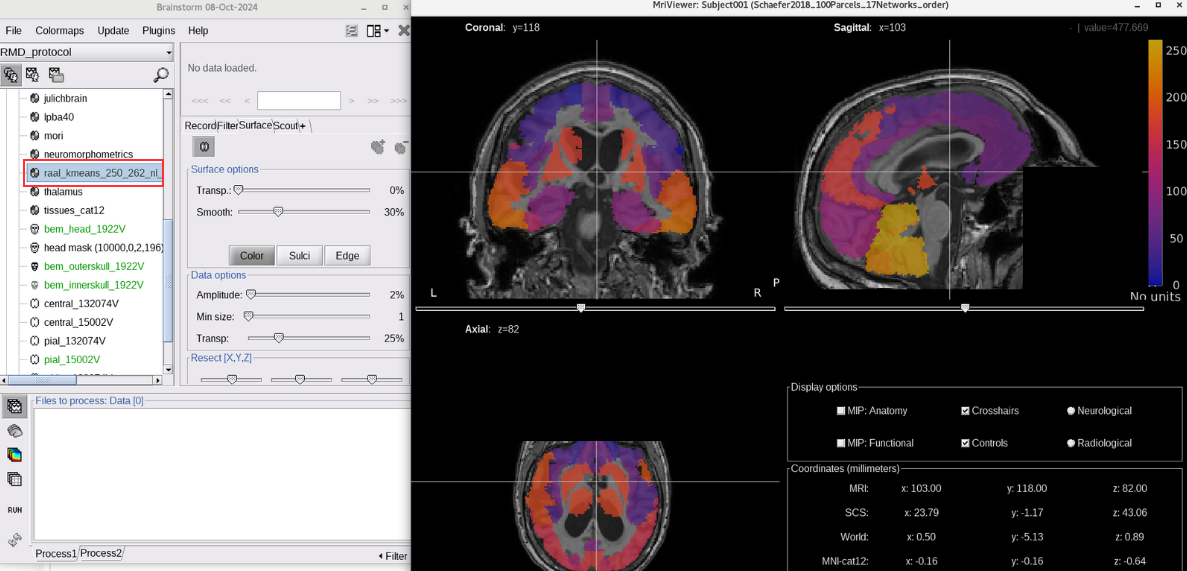
This other one, instead, is the comparison between the aal3 parcellation from cat12 (launched from Brainstorm) and mi raal atlas. Since the raal should be an over-parcellization of the aal3 (but I was not involved in the process of creating it), I do not know if the results are good or not. My impression is that they are ok, but maybe non perfectly matched (as the highlighted area suggests)
Since you're far more expert than me, if you say that this import is good and I can work from this point on, I'm ok with it. Once I imported the atlases, I applied the transformation that Brainstorm suggests, registered the image with the reference MRI, and resliced the volume
Have you performed this comparison in other software, one dedicated to MRI visualization? E.g. MRIcron, FSL (FSLeyes), Matlab's volume viewer, and so on
Unfortunately I cannot share the MRI file because of the policy of my workplace. Anyway, I tried importing without the transformation, coregistration and reslicing, and the results seemed okay, but slightly shifted to the right. I tried again, but this time keeping the coregistration (using SPM), and the results now seems actually very good! Thanks for the help!