We applied the processing pipeline illustrated in the attached image and exported the resulting group analysis data to MATLAB.
Subsequently, we used the attached script to extract vertex information corresponding to a specific scout.
However, we have observed that, even when applying the same pipeline to the same subject, the extracted numerical values vary slightly with each run.
Could you please clarify why such discrepancies occur?


This ![]() pipeline with three processes will lead always to the same result if the same input is used.
pipeline with three processes will lead always to the same result if the same input is used.
Thus, the difference between executions may be in your custom code.
The who function returns the variables in the current active workspace in alphabetic order, but there is not way to ensure that sublist{1} is always the same variable. The same happens in the FOR loop over sublist maybe your variables in your workspace are different between runs.
Also, structures S1 and M1 are not described in your code, so it is not possible to us to figure out what is going on with the script. I suggest you to carefully check your code. As advise, avoid using eval: https://www.mathworks.com/help/matlab/matlab_prog/string-evaluation.html
@Raymundo.Cassani
Thank you very much for your kind support and for taking the time to provide such a detailed response to my insufficiently explained question.
For your information, the data loaded at the beginning of the MATLAB script corresponds to the S1 and M1 scouts exported from the Desikan-Killiany atlas within Brainstorm.
Using this data, the script extracts the vertices corresponding to S1 and M1 from the full set of approximately 15,000 vertices.
In this context, is it possible that the vertices extracted from within the S1 or M1 regions vary randomly with each execution, even though the scout regions remain the same?
Any insights you can provide would be greatly appreciated.
No, they should not change. The Scout definition (label and vertices) is organized in the Atlas structure that they correspond, and this Atlas information is stored in the Surface file that the Atlas was computed for. See more details in here
With that said. A potential source of variation is that you are reading two different definitions for the Scout, i.e, reading the same Scout, same Atlas but from different surface.
@Raymundo.Cassani
Thank you very much for your accurate and helpful advice.
I may have identified the reason why the extracted data differed.
It appears that there was a discrepancy in the frequency bands specified during the analysis steps in the attached pipeline.
This leads me to a new question:
Why would the inclusion or exclusion of the gamma-1 and gamma-2 frequency ranges affect the values observed in the alpha band?
Any clarification on this matter would be greatly appreciated.
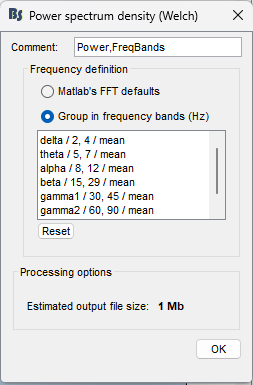
This happens because the process Spectrum normalization is called after computing the PSD.
In Spectrum normalization, the power for each bands is divided by the total power (which is computed as the sum of all the bands). As you can see, when the PSD contains or not the bands gamma1 and gamma2, the total power changes, thus the relative power for other bands.
Since the PSD follows a the 1/f power law, the contribution of gamma1 and gamma2 is small. This means that the relative power for alpha is slightly small when these gamma bands are considered to compute the total power.