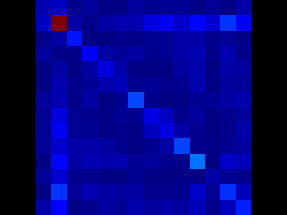
I am doing some exploratory analysis of EEG data and have a question re: interpretation of the noise covariance matrix. I looked at all the noise covariance posts in the forum but did not see guidance re: this basis question. (Pardon the very basic question but I've learned that this is a very useful and kind forum.) How should I interpret the attached image? Should I consider the second sensor as bad? FYI - I do not intend to use these data for source estimation given the small number of sensors, just interested in sensor space. Thank you!
This red value on the diagonal indicates that the corresponding sensor has a higher variance than the other sensors.
In EEG, this is typical of an electrode recording signals that are noisier than the others.
This doesn’t necessarily mean that the corresponding channel should be marked as bad. The color mapping of this figure is arbitrary, it is based on the highest value on the figure, red means noisier but not necessarily “too noisy to be used”.
To decide whether you want to keep or remove this channel, I’d recommend you look at the shape of the signals and the corresponding topographies. It the value of this electrode look coherent with its neighbors, maybe you can keep it.
Thank you! And so the corresponding channel here is 2?
I guess so. You can right-click on the noise covariance > File > Export to Matlab, and explore this from your Matlab command line.
