Hi,
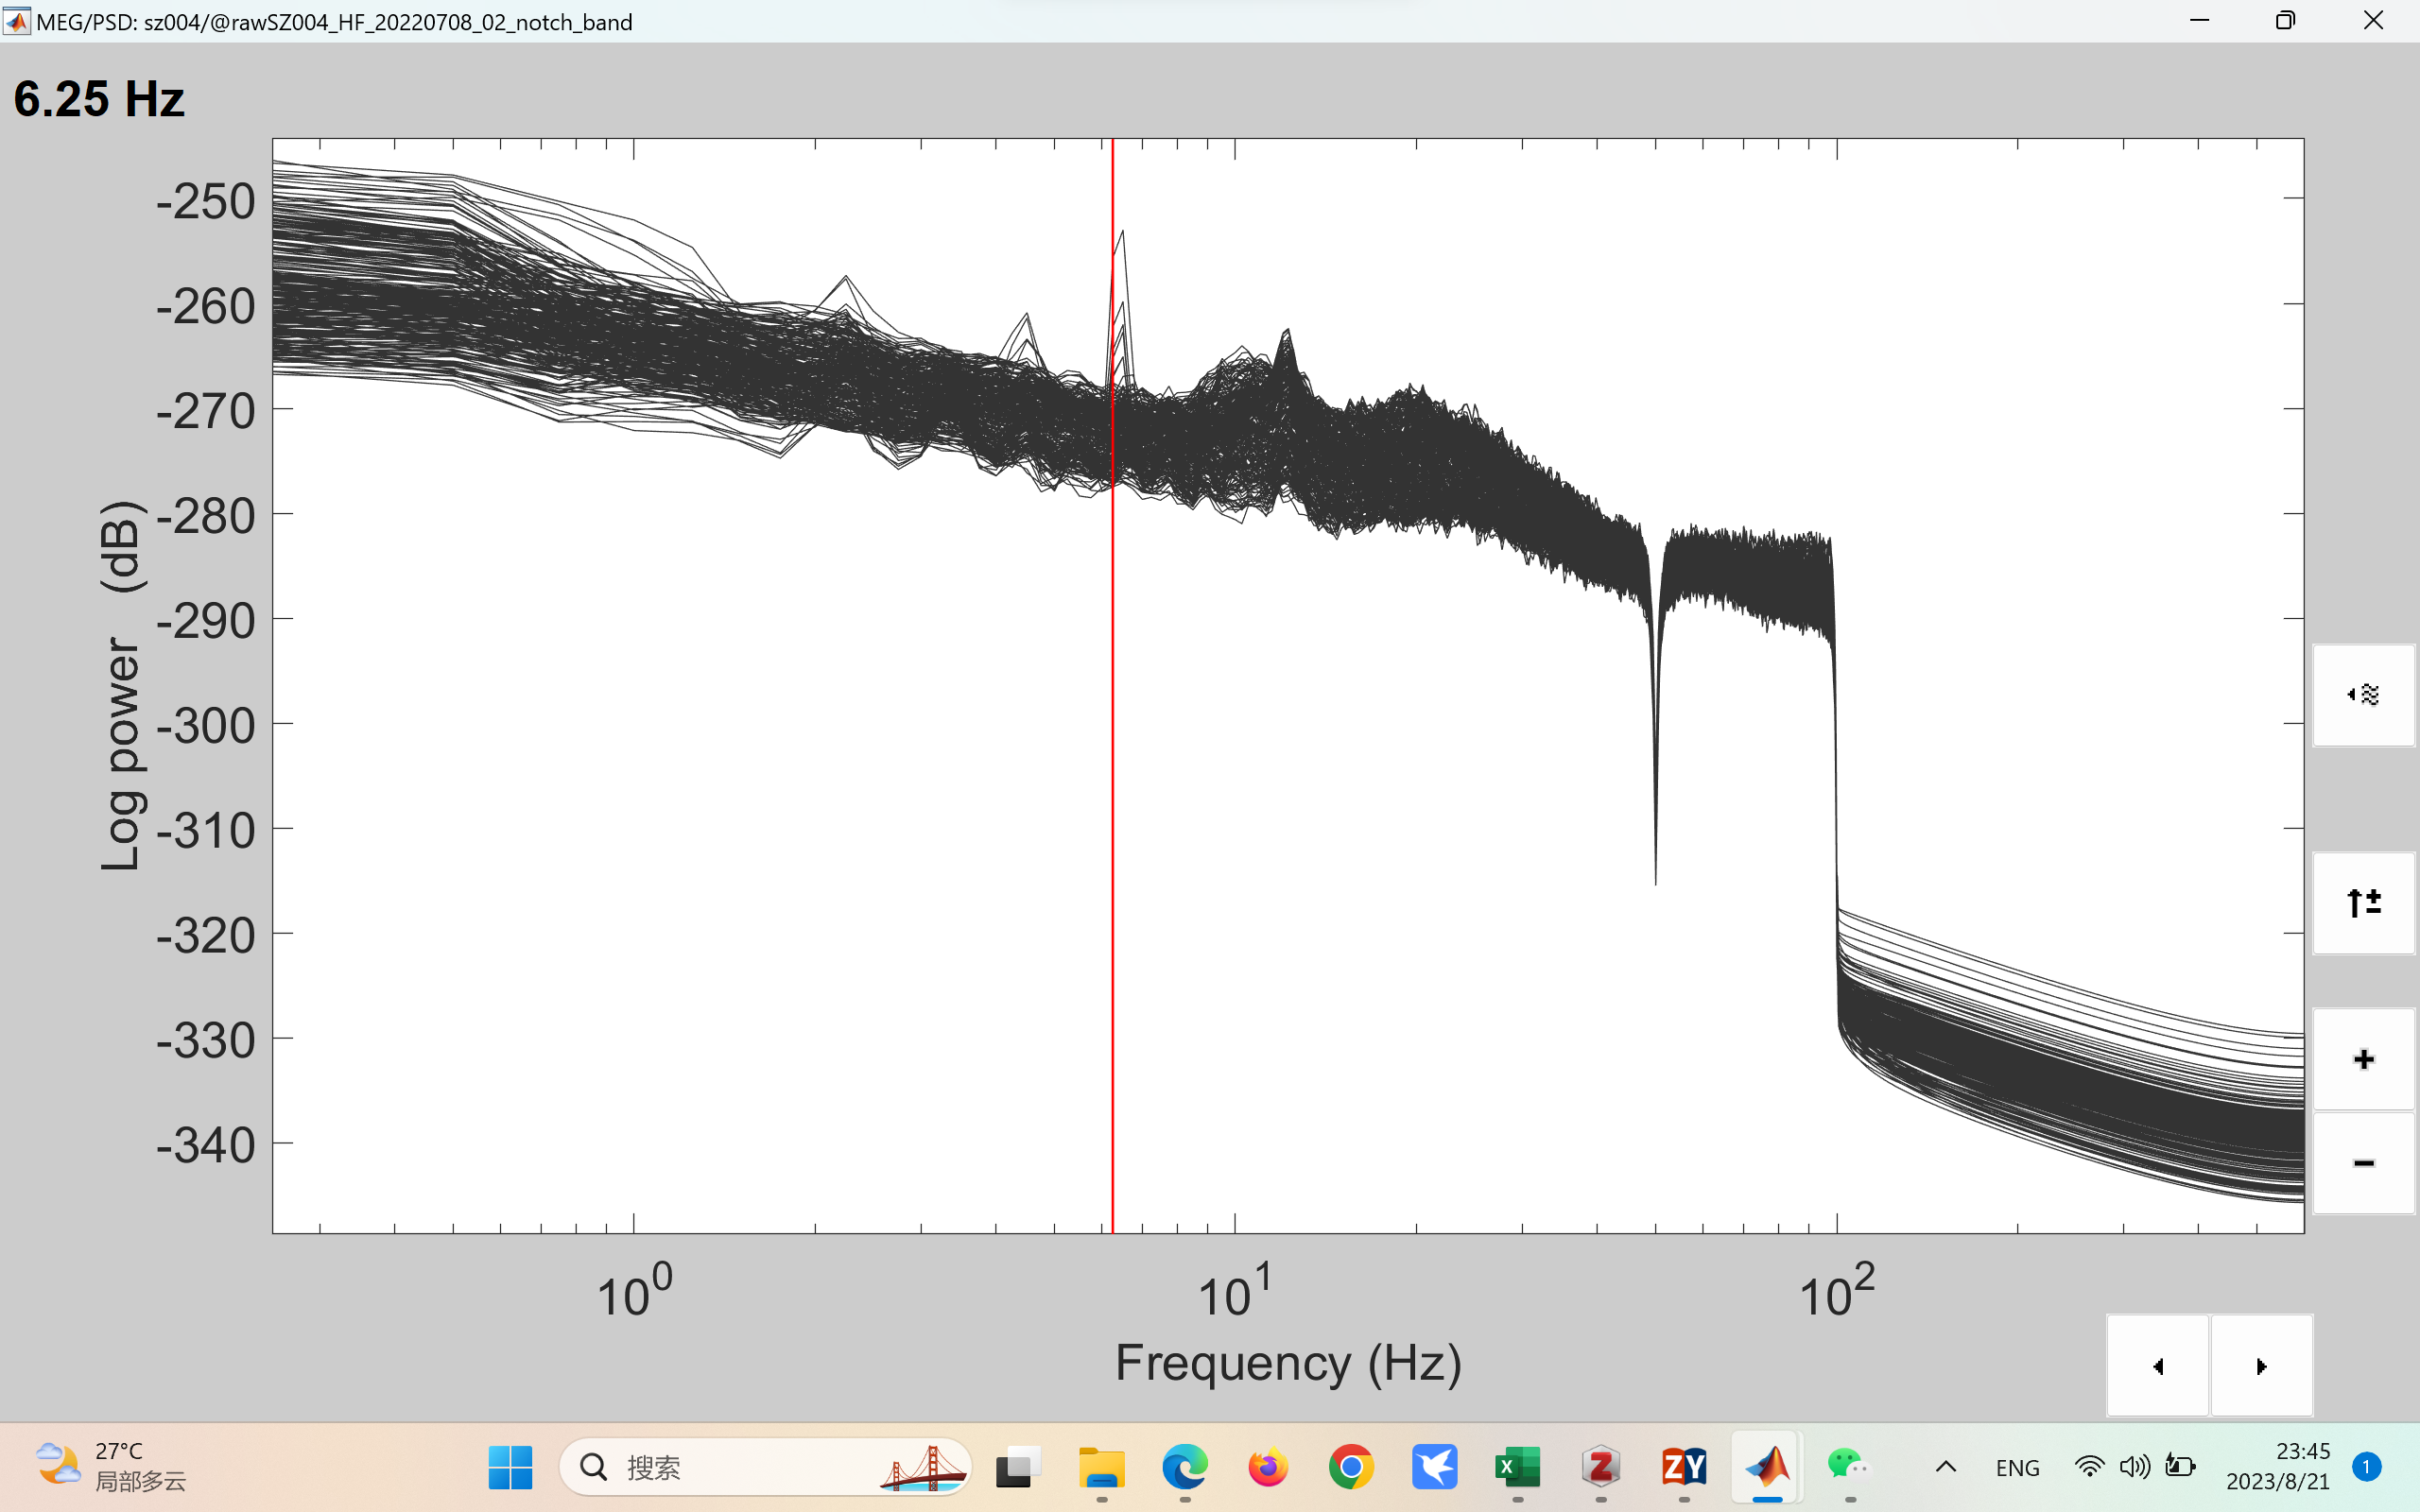
I pre-processed t segments of MEG data, then ran a Power Spectral Density analysis (Welch's). I would like some help to explain the results. I am not able to identified whether the peaks at 6.25hz and 6.5hz are artifacts. If they are, what should I do with them. mark them as bad channel, or apply a notch filter.
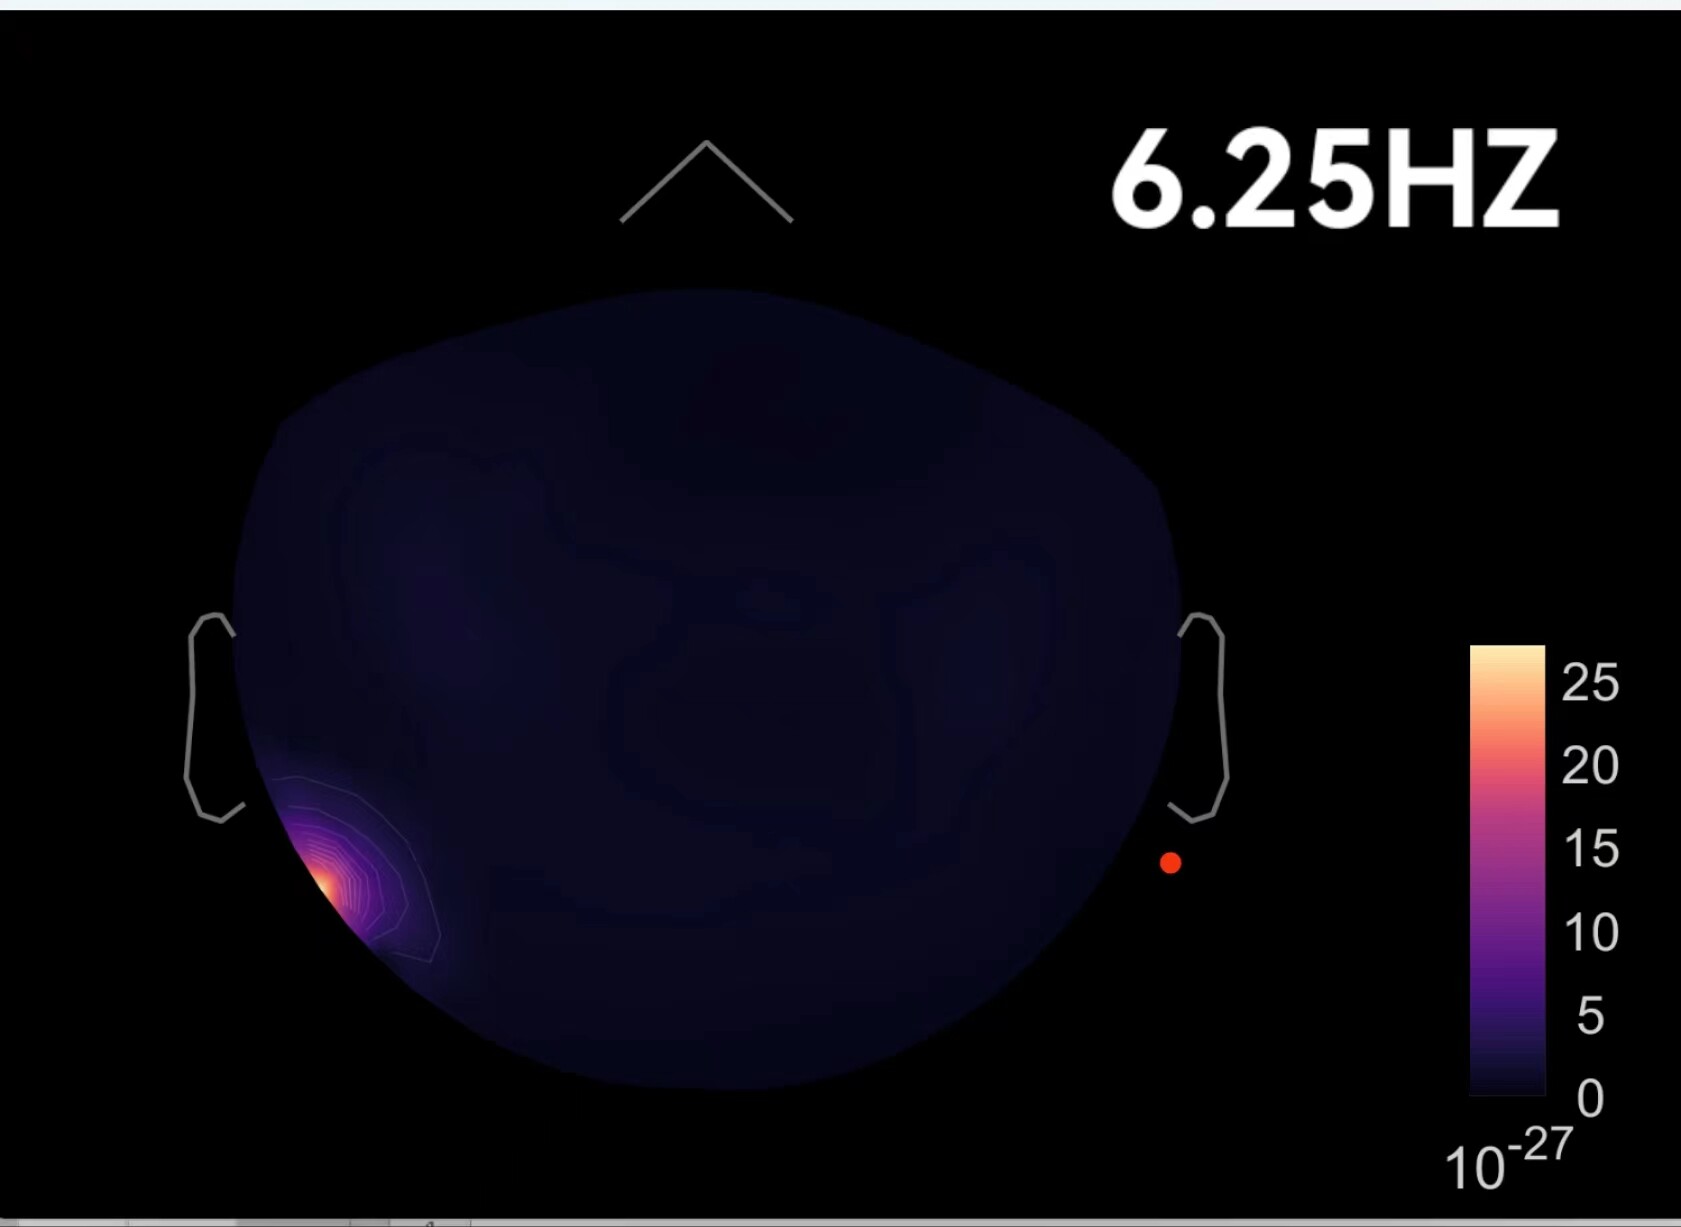
The sensor topography looks artifactual indeed. I would recommend you use it as an SSP projector, which will be more specific than a notch filter. In other words, it will remove signal components with this spatial topography but will preserve the rest of the data at 6.25Hz.
See: https://neuroimage.usc.edu/brainstorm/Tutorials/SSPCookbook?highlight=(ssp)#Example_2:_SSP_from_a_topography