Interpreting baseline noise within scout-level time series

Hello,

I am dealing with time locked data and have a baseline of 500 ms. When I average my trials, the time series show a relatively clear response contrasting with the baseline. However, when I compute the sources (LCMV, median eigenvalue, constrained), the baseline appears far less different than the stimulus window at scout-level. Is that something I can expect?

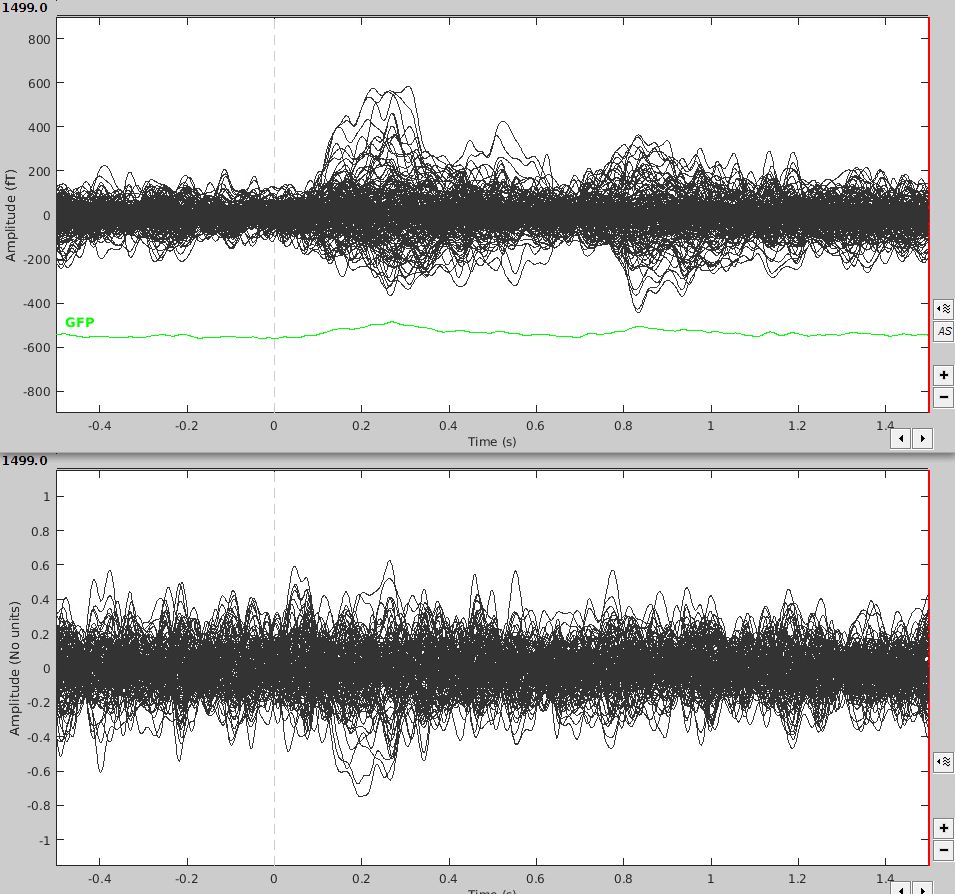
Here is an example with a graph showing the average time series above, and all scout means of the source of that same average (I'm not sure how comparable it is as it's more an accumulation of source means than an overall mean, but I don't know if I can display a mean whole-brain source space time series).

Doing baseline standardization helps. However I'm looking at computing the difference between stimuli, and your "Difference" tutorial suggest I add baseline z-score normalization at that point. When I do it seems only to transform it into a z-score (leaving the noisy baseline untouched). Maybe I just don't understand what it's doing?

I also have another question: is it possible to do a baseline standardization on the time series before computing the source of the signals? No source is being computed on the z-score standardized average when I attempt that. Is it doing the same thing if I do a baseline standardization at source level (so after computing sources)?

Many thanks,

Charly

However, when I compute the sources (LCMV, median eigenvalue, constrained), the baseline appears far less different than the stimulus window at scout-level. Is that something I can expect?

This depends on many factors: from which data your data and noise covariance were computed, and how you define your scouts.
If you used large scouts, such as the anatomical regions defined in the Desikan-Killiany parcellation, there is a chance that you averaged out your effect of interest, if it was focal.
In a good case scenario, if you have one focal brain source that is correctly identified by the source reconstruction algorithm, you would get one scout with higher values, and mostly noise for all the others. It is not necessarily meaningful to plot all the scouts overlaid on top of each other.

The computation of a correct data covariance matrix is not an easy task, and if it is not targeting correctly the effect of interest, LCMV beamformer results might look bad.
I'd recommend you start with easier solutions, as described in the introduction tutorials: use a minimum-norm solution, with constrained orientations, and normalized with dSPM.
To get started with the source exploration: open the dSPM maps on the surface in 3D, explore around the peak of the MEG response (200-300ms), create a small scout on top of the activity you observe, and plot the time series for just this scout.

but I don't know if I can display a mean whole-brain source space time series

Computing the average of all the source time series would probably as uninteresting as averaging all the MEG signals together... You can't really average signals that cancel out each other. If you want a global measure of "activity", you can compute e.g. the sum of the square values (just like for the GFP green line in the average plot).

When I do it seems only to transform it into a z-score (leaving the noisy baseline untouched).

This is what it does, indeed.
https://neuroimage.usc.edu/brainstorm/Tutorials/SourceEstimation#Standardization_of_source_maps

is it possible to do a baseline standardization on the time series before computing the source of the signals?

No. You need the relative values of the various MEG sensors to remain constant for the electromagnetic models to be valid.

Is it doing the same thing if I do a baseline standardization at source level (so after computing sources)?

Not at all.

Hi François,

Many thanks that's very helpful. It makes a lot of sense that averaging would do the opposite of what I'm seeking (not an absolute activity but a meaningful sign).

Both the data covariance and noise covariance were computed from the set of trials (each trial having the same 500ms baseline), not the averaged file, if that matters.

I did use parcellation scouts. Making my own scout does give a much more coherent time series.
However my issue with creating a scout myself is that I would like my methods to be standard across participants, and it seems like I cannot copy users scout in another subject (each has his own anatomy model). Even if I could, it seems like there's inter-subject variability. I was wondering if there was a way to automatically define a scout based on a "cluster" of high amplitude, so I can minimize manual selection ?

dSPM does give different outputs, and at times quite different patterns of activation. Would you argue it is more trustable because of the prewhitening of the data?

You can project your scout to any of the subject:
https://neuroimage.usc.edu/brainstorm/Tutorials/Scouts#Menu:_Scout

You could define a scout on the template anatomy, based on the grand average source maps (project all the subject-level average source results to the template anatomy), and project it on the cortex surface of each individual subject.
Or, simply work at the template level, with all the subject averages projected onto the default anatomy.

I was wondering if there was a way to automatically define a scout based on a "cluster" of high amplitude, so I can minimize manual selection ?

No, not automatically.

dSPM does give different outputs, and at times quite different patterns of activation. Would you argue it is more trustable because of the prewhitening of the data?

It is not dependent on the selection of data covariance, and therefore less prone to manipulation or interpretation errors.
Our recommendations: https://neuroimage.usc.edu/brainstorm/Tutorials/SourceEstimation#Standardization_of_source_maps