Hi
I'm sorry I know these days I'm asking many questions,
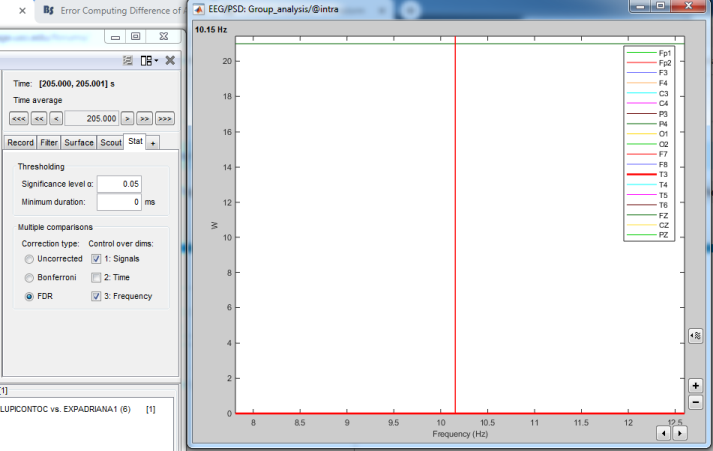
I run a permutation paired test on welch power files in 2 groups, I think it worked, but I'm not sure about results:
Each file has the computation of welch PSD in 4 bands (Alpha, Beta, Delta, Theta), in the test options I set the frequency in Alpha band (7.81 - 12.5)
I got this:
Can anyone help me to understand:
What does it mean? does it mean that there is a significant difference in Alpha band at 10.15 Hz just in Fp1 electrode?
How can I find why is that difference (I mean, If the welch psd was higher or lower)?
and How can I get and export the numeric statistical data (mean, median, p values) from this test?
Thanks a lot!!!
What does it mean? does it mean that there is a significant difference in Alpha band at 10.15 Hz just in Fp1 electrode?
I guess you have only one value per electrode (no time dimension, no frequency dimension), the flat line represents the one single value for your entire frequency band. It would be more meaningful to display these results as a 2D topography.
How can I find why is that difference (I mean, If the welch psd was higher or lower)?
Display your file as a 2D topography, make sure that the colormap is configured to display both positive and negative values, and then values >0 should indicate that files A > files B in your test.
See statistics tutorial: https://neuroimage.usc.edu/brainstorm/Tutorials/Statistics
How can I get and export the numeric statistical data (mean, median, p values) from this test?
These values are saved in a Matlab .mat file, like all the other files in the Brainstorm database. Right-click on the file > File > check out the many options to manipulate the file itself.
https://neuroimage.usc.edu/brainstorm/Tutorials/Scripting#Custom_processing
And/or apply the statistics threshold to this file before:
https://neuroimage.usc.edu/brainstorm/Tutorials/Statistics#Convert_statistic_results_to_regular_files
1 Like