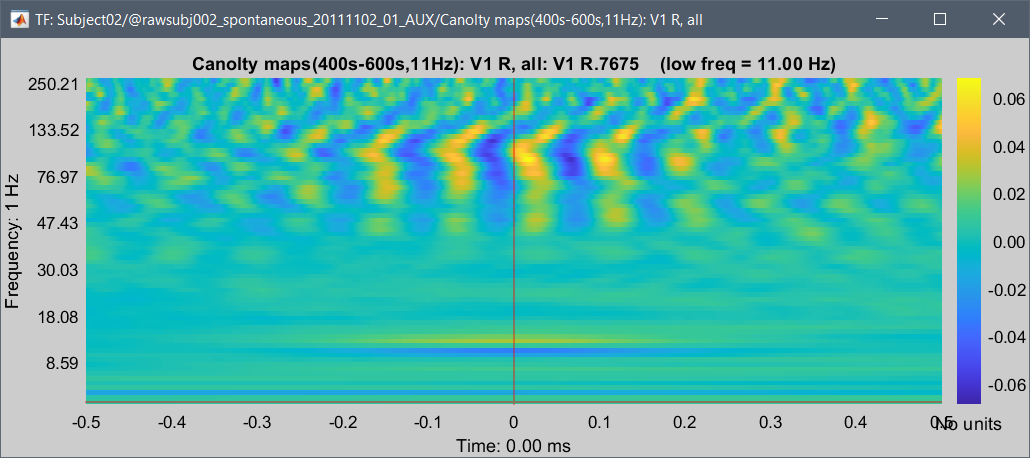
The maps in your second post above take negative values because they show z-scored power measures of the faster oscillations coupled to the slow component in question. They are z-scored with respect to the mean and standard deviation of the 1-s epoch you are looking at.
Indeed, see the code computing these maps for more information:
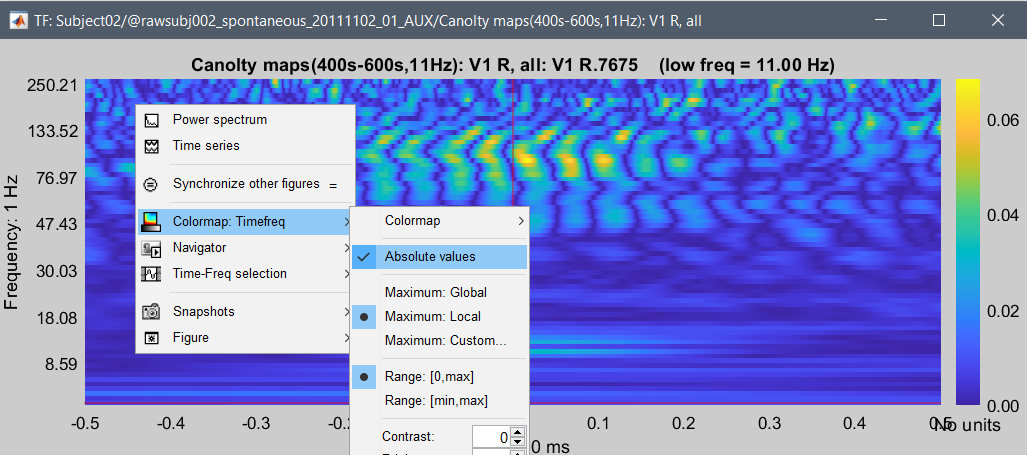
You can configure the colormap of the TF figure so that it shows the positive and negative values in the figure: