Dear Brainstorm community,
I would like to see whether there is a difference in Granger connectivity between a group of subjects with two conditions. I am now perfom non-parametric permutation paired test with the Granger connectivity matrix results of two conditions (the connectivity is 3x3). I got the test results(also a 3x3 matrix), but i have no idea what's the meaning of value in matrix.
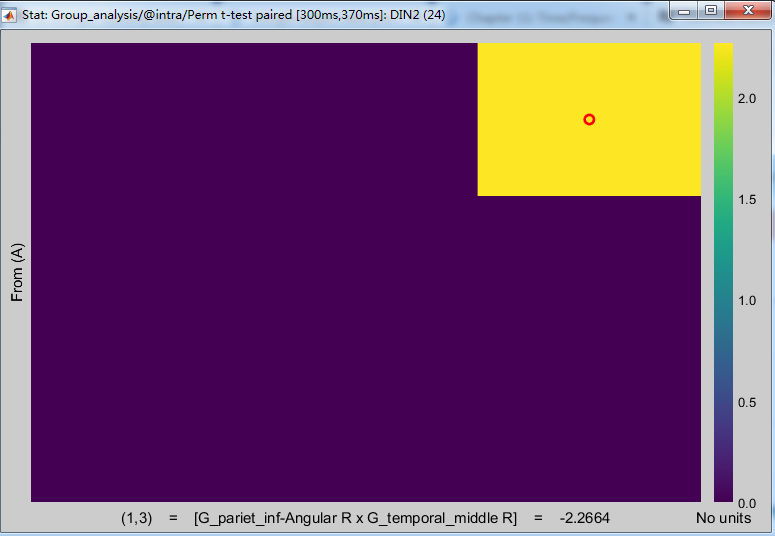
One of the test results are show in below.
Looking forward to your reply.
Yuan
Hi Yuan,
What is displayed are the significant t-values of your statistics test, with values that have p-values higher than the significance level threshold (α) set to zero (this is adjusted in the Stat tab). Note that your colormap seems to be in absolute value here as the regions you have selected have a negative t-value yet it is displayed in yellow.
For more information, please refer to our statistics tutorial:
https://neuroimage.usc.edu/brainstorm/Tutorials/Statistics
Best,
Martin
Hi Martin,
Thank you very much for your reply.
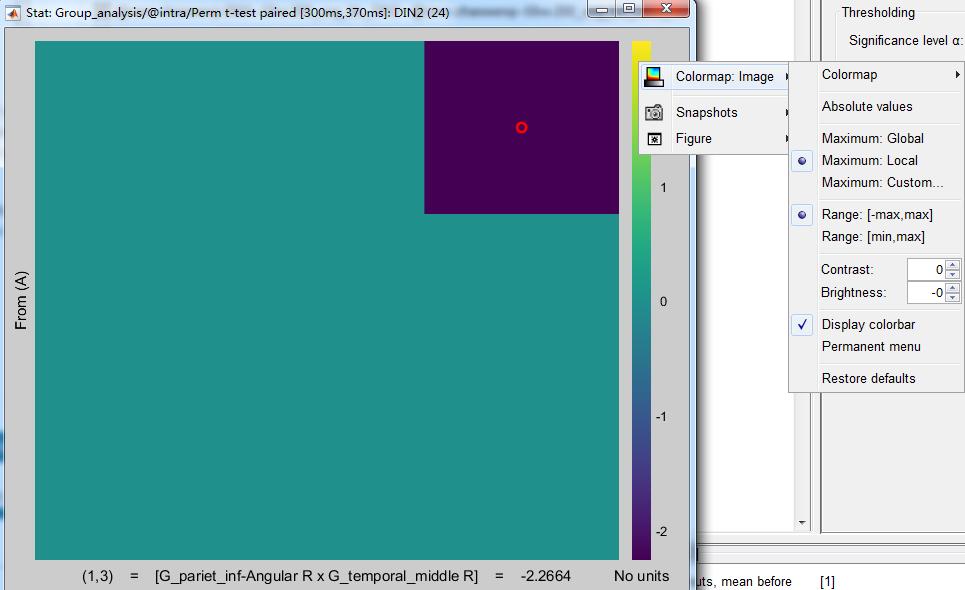
According to your reply, I uncheck the 'Absolute values' in my colormap and the test results changed are show in below.
My question is:
(1)The values that have p-values higer than the significance level threshold are set to zero, what about the values that have p-values lower than the significance level threshold should be.
(2)Does the test results with a negative t-value are a correct test results. As the picture show in above, the regions i selected is still a negative t-value. If the negative t-value can be accepted as a correct result, may i think the negative value mean that there is a significant difference.
Looking forward to your reply.
Yuan
(1)The values that have p-values higer than the significance level threshold are set to zero, what about the values that have p-values lower than the significance level threshold should be.
They are left untouched, showing the actual t-statistic.
(2)Does the test results with a negative t-value are a correct test results.
A negative values means that your files in your group A have a significantly lower value that the files in your group B.
If you are not comfortable with these concepts, you should read about statistical testing before trying to use these tools. Statistical results computed without knowing exactly what you are doing have high chances to be meaningless.
Then before applying these concepts to your data in Brainstorm, I recommend you start by following the introduction tutorials until the statistics tutorial using the example dataset, as previously suggested by Martin.
Thank you very much for your valuable comments.