Dear Brainstorm community,
in a within subject design, I have 11 participants who are tested twice, once at time A, and then again at time B.
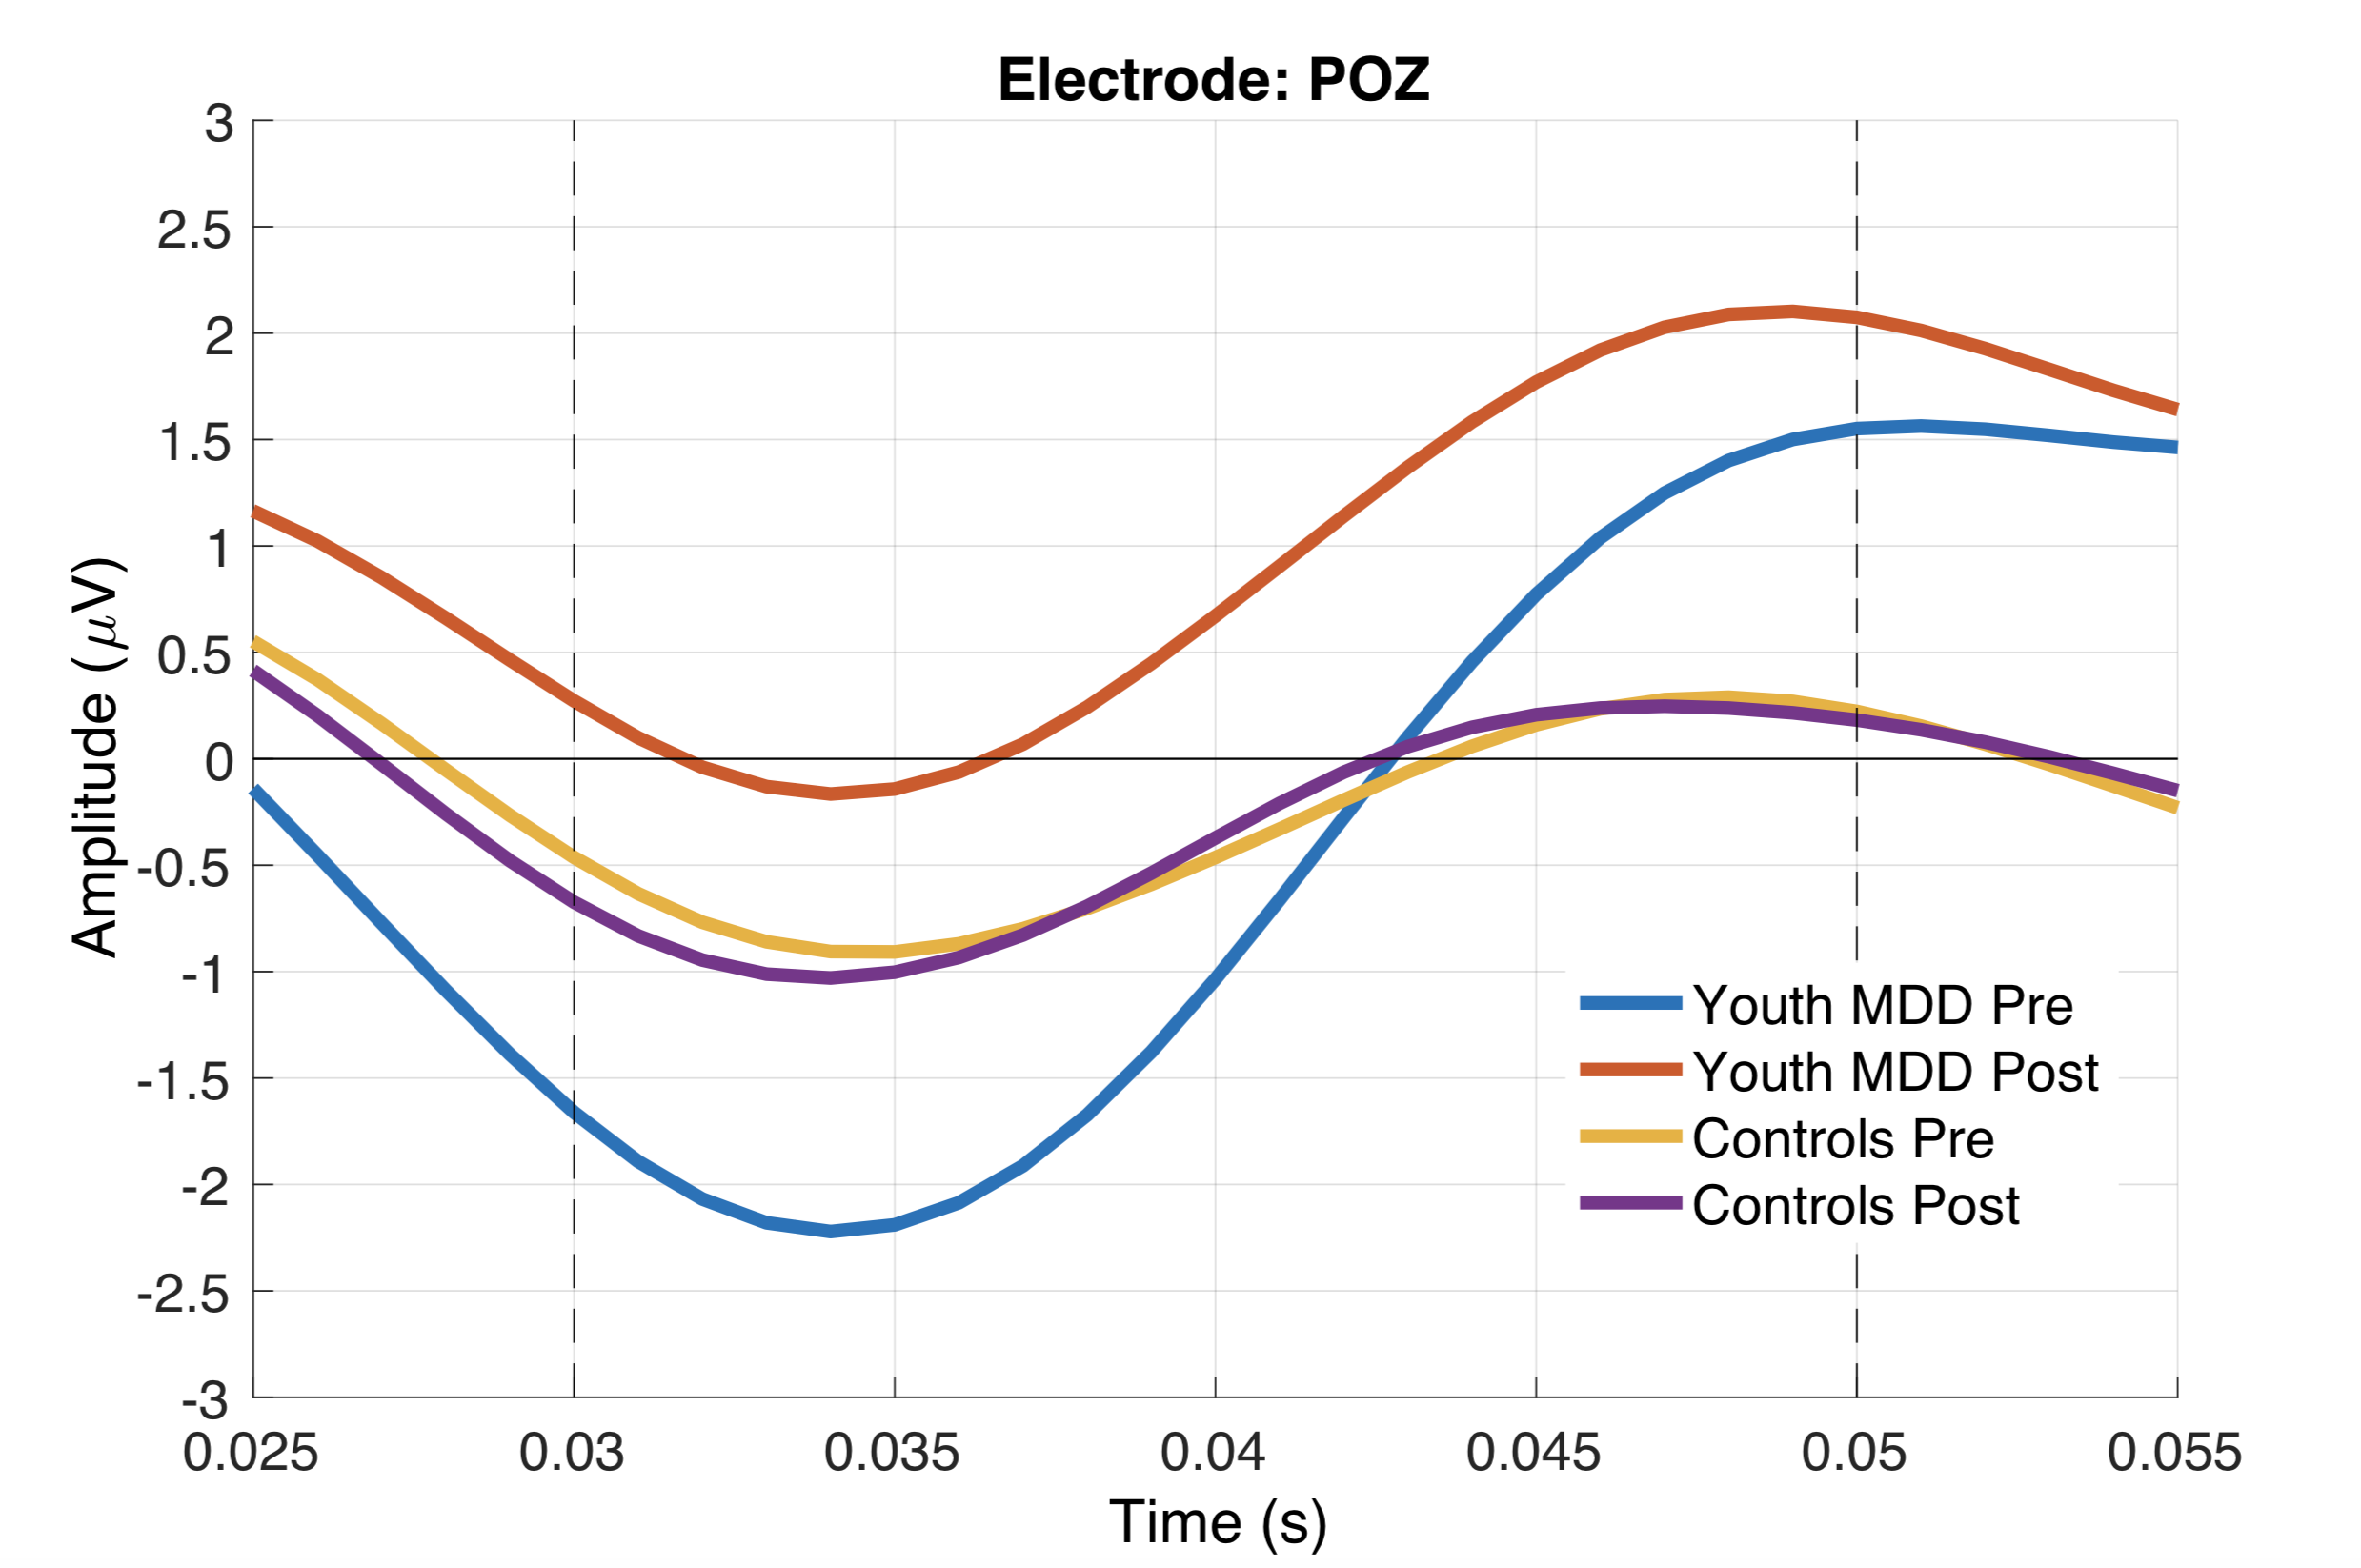
I have a significant effect at the sensor level (corrected for multiple comparisons), and looking at the ERP (30 - 50 ms), the component I am interested in decreases in negativity (smaller negative deflection) from time A to B (please ignore the Controls).
I then wanted to do source localization of this effect.
After following the tutorials on 'Differences' as well as the 'Statistics' and 'Workflows' in the context of paired samples, I got to my source localization (in t-statistic values):

Now, having looked at both the statistics and differences, I'm arriving to the interpretation that Time B > Time A in regards to activity in the source level based on looking at |A|-|B|, due to me being interested in simply which condition is greater/lesser than the other with regards to activity.
My confusion then comes in the context of applying the absolute value to my source files, and based off the negative deflection of time A being greater than time B for the ERP, is it wrong to have assumed that for my source localization, time A should have exhibited greater activity than time B?
Any thoughts on this would be greatly appreciated.
Thank you,
Paul