Hi, Francois,
Is Granger causality analysis a linear operation? There are two methods of operation:
(1) Source analysis is performed on each trail, and then Scouts of interest are defined on the source. Granger analysis of NxN is performed on these scouts, and multiple connection matrices are obtained. Finally, an average connection matrix is obtained by averaging multiple matrices.
(2) Average trail on sensor directly, such as getting ERP signal. Then the source of ERP is analyzed. Scut is defined on source, and then the NxN Granger analysis between these Scouts is carried out to obtain a NxN matrix.
My question is:
(1) Is the result of the second way the same as that of the first way?
(2) If not, is the error caused by the second method tolerable?
No, the Granger causality is not linear, you cannot permute the average and the connectivity measure with any of the connectivity methods available in Brainstorm.
You need long signals to estimate properly the interactions between two signals, an ERP is most of the time too short.
@hossein27en Do you have any additional advice to share?
Hi, Francois,
Thank you very much for your reply.
In my study, the time of each trial was 5.5 seconds, first the baseline signal of 0.5 seconds, then the stimulation signal of 5 seconds. There are 30 trails under each experimental condition.
My question is:
(1) The correct calculation method should be as follows: Granger connection is computed for each trial, and the average Granger connection matrix under the experimental conditions is obtained by averaging all trial connection matrices. Am I right?
(2) In addition, for Granger causality analysis, is the length of stimulation signal of 5S long enough (equal to the length of ERP)?
(3) If the length of 5S is too short for Granger connection analysis, is it impossible to use Granger analysis method? Is there any time requirement for other connection methods?
I wonder if it is not better to concatenate all the signals first and then compute the GC, as available directly in the options of the GC process in Brainstorm.
(2) In addition, for Granger causality analysis, is the length of stimulation signal of 5S long enough (equal to the length of ERP)?
(3) If the length of 5S is too short for Granger connection analysis, is it impossible to use Granger analysis method? Is there any time requirement for other connection methods?
(1) The correct calculation method should be as follows: Granger connection is computed for each trial, and the average Granger connection matrix under the experimental conditions is obtained by averaging all trial connection matrices. Am I right?
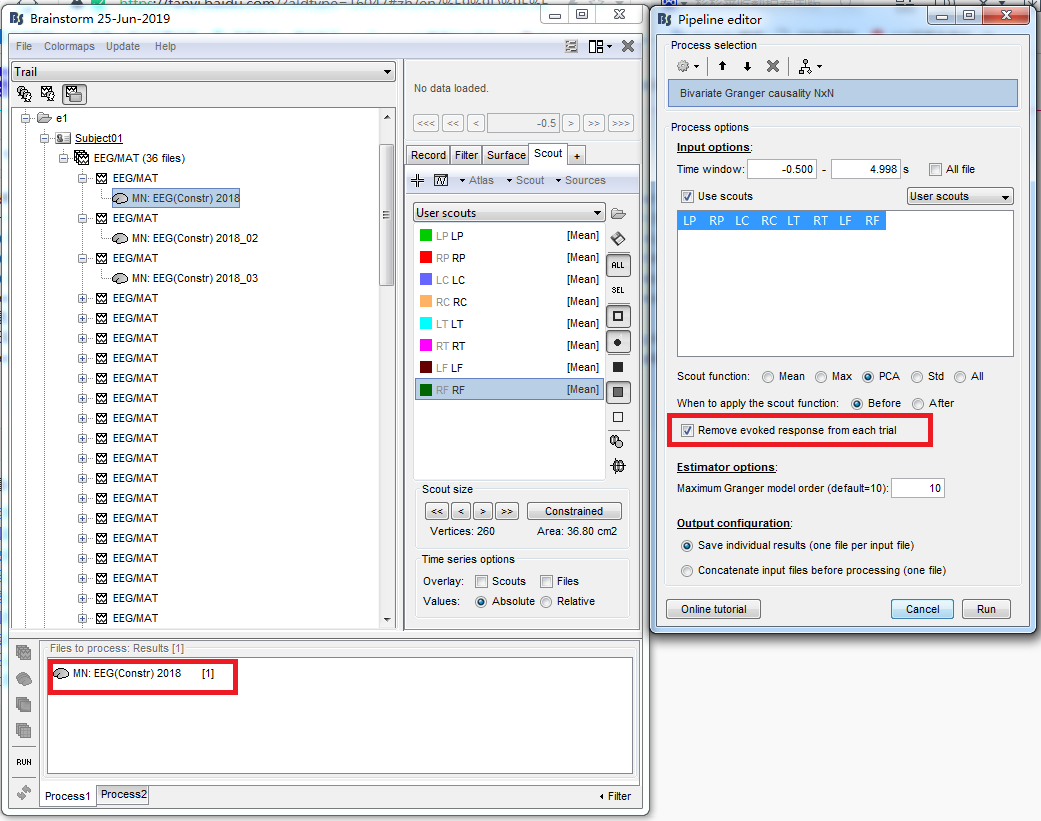
Yes, But you need to subtract the average signal (ERP) of each condition from their corresponding trails before computing the connectivity. We have this option in Brainstorm (remove evoked response).
.(2) In addition, for Granger causality analysis, is the length of stimulation signal of 5S long enough (equal to the length of ERP)?
It depends on your sampling rate and other factors, like how many parameters you have, but roughly should be okay.
(3) If the length of 5S is too short for Granger connection analysis, is it impossible to use Granger analysis method? Is there any time requirement for other connection methods?
Since you have 30 trails it should give you an acceptable SNR.
Thank you very much for your reply.
One of my processes is not clear.
(1) First, source estimation is performed for each trial.
(2) Define Scouts of interest in source space
(3) Granger causality analysis was conducted among interested scouts, and the option of removing evoked response was checked.
(4) The Granger analysis results of each participant are the average of the Granger connection matrices of multiple trials (at this time, one participant corresponds to an average connection matrix).
(5) The average result of all participants is the average of the connection matrix of each subject.
(6) Setting the appropriate threshold to determine the causal connection between scouts.
Is the above process correct?
In addition, I found that when calculating in source space, the results are the same regardless of whether the option (remove evoked response) is chosen or not.
Yeah that procedure looks good to me. Unless if you wanna do a statistical test you should preserve subjects values.
I don't know why removing the evoked response doesn't change your result.
How similar are the connectivity matrices for different trials?
Another question, if I want to further compare whether there are statistical differences in Granger causality under two different conditions (A and B):
(1) First, source estimation is performed for each trial under each condition.
(2) Define Scouts of interest in source space.
(3) Granger causality analysis was conducted among scouts for each trial of each participant.
(4) For each subject i, the Granger connection matrix corresponding to all trials under condition A is subtracted from all trials under condition B, Cij = Aij-Bij, i is the number of the subject, and j is the number of trials.
(5) For each subject i, take the average of Cij under all trials, Di = average (Cij) = average (Aij-Bij). Di is the difference matrix corresponding to the final two conditions obtained by each participant.
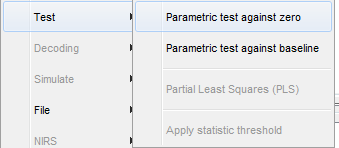
(6) Di was tested by "Process1-Test-Parametric Test against zero "for all subjects.
Is the above process correct?
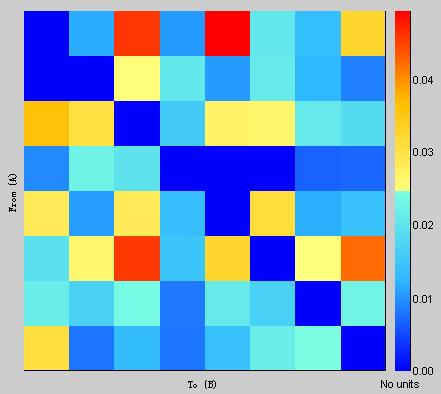
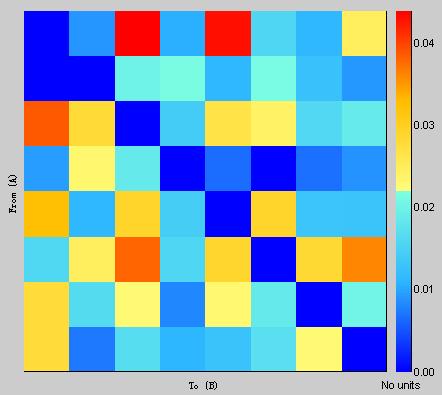
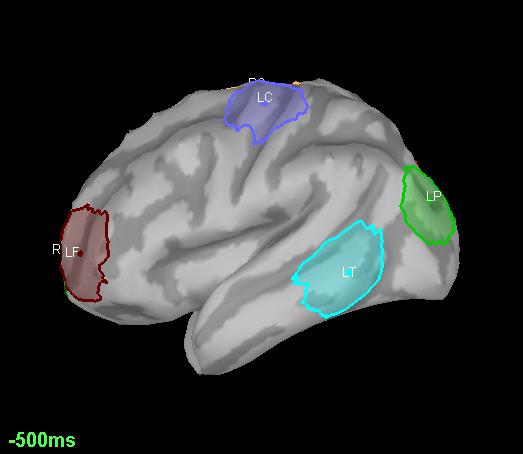
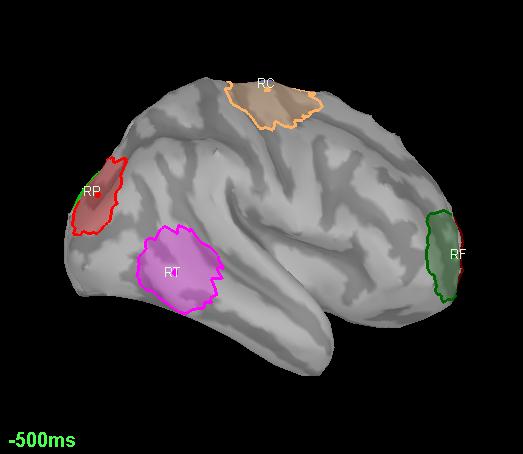
Another problem is that I define some scouts on the source and get an average Granger connection matrix under a condition.Four scouts are defined in the left and right hemispheres, as shown in the following figure.
LP/RP was located in occipital lobe, LT/RT in temporal lobe, LC/RC in parietal lobe and LF/RF in prefrontal lobe. LF and RF are farther away from other scouts.
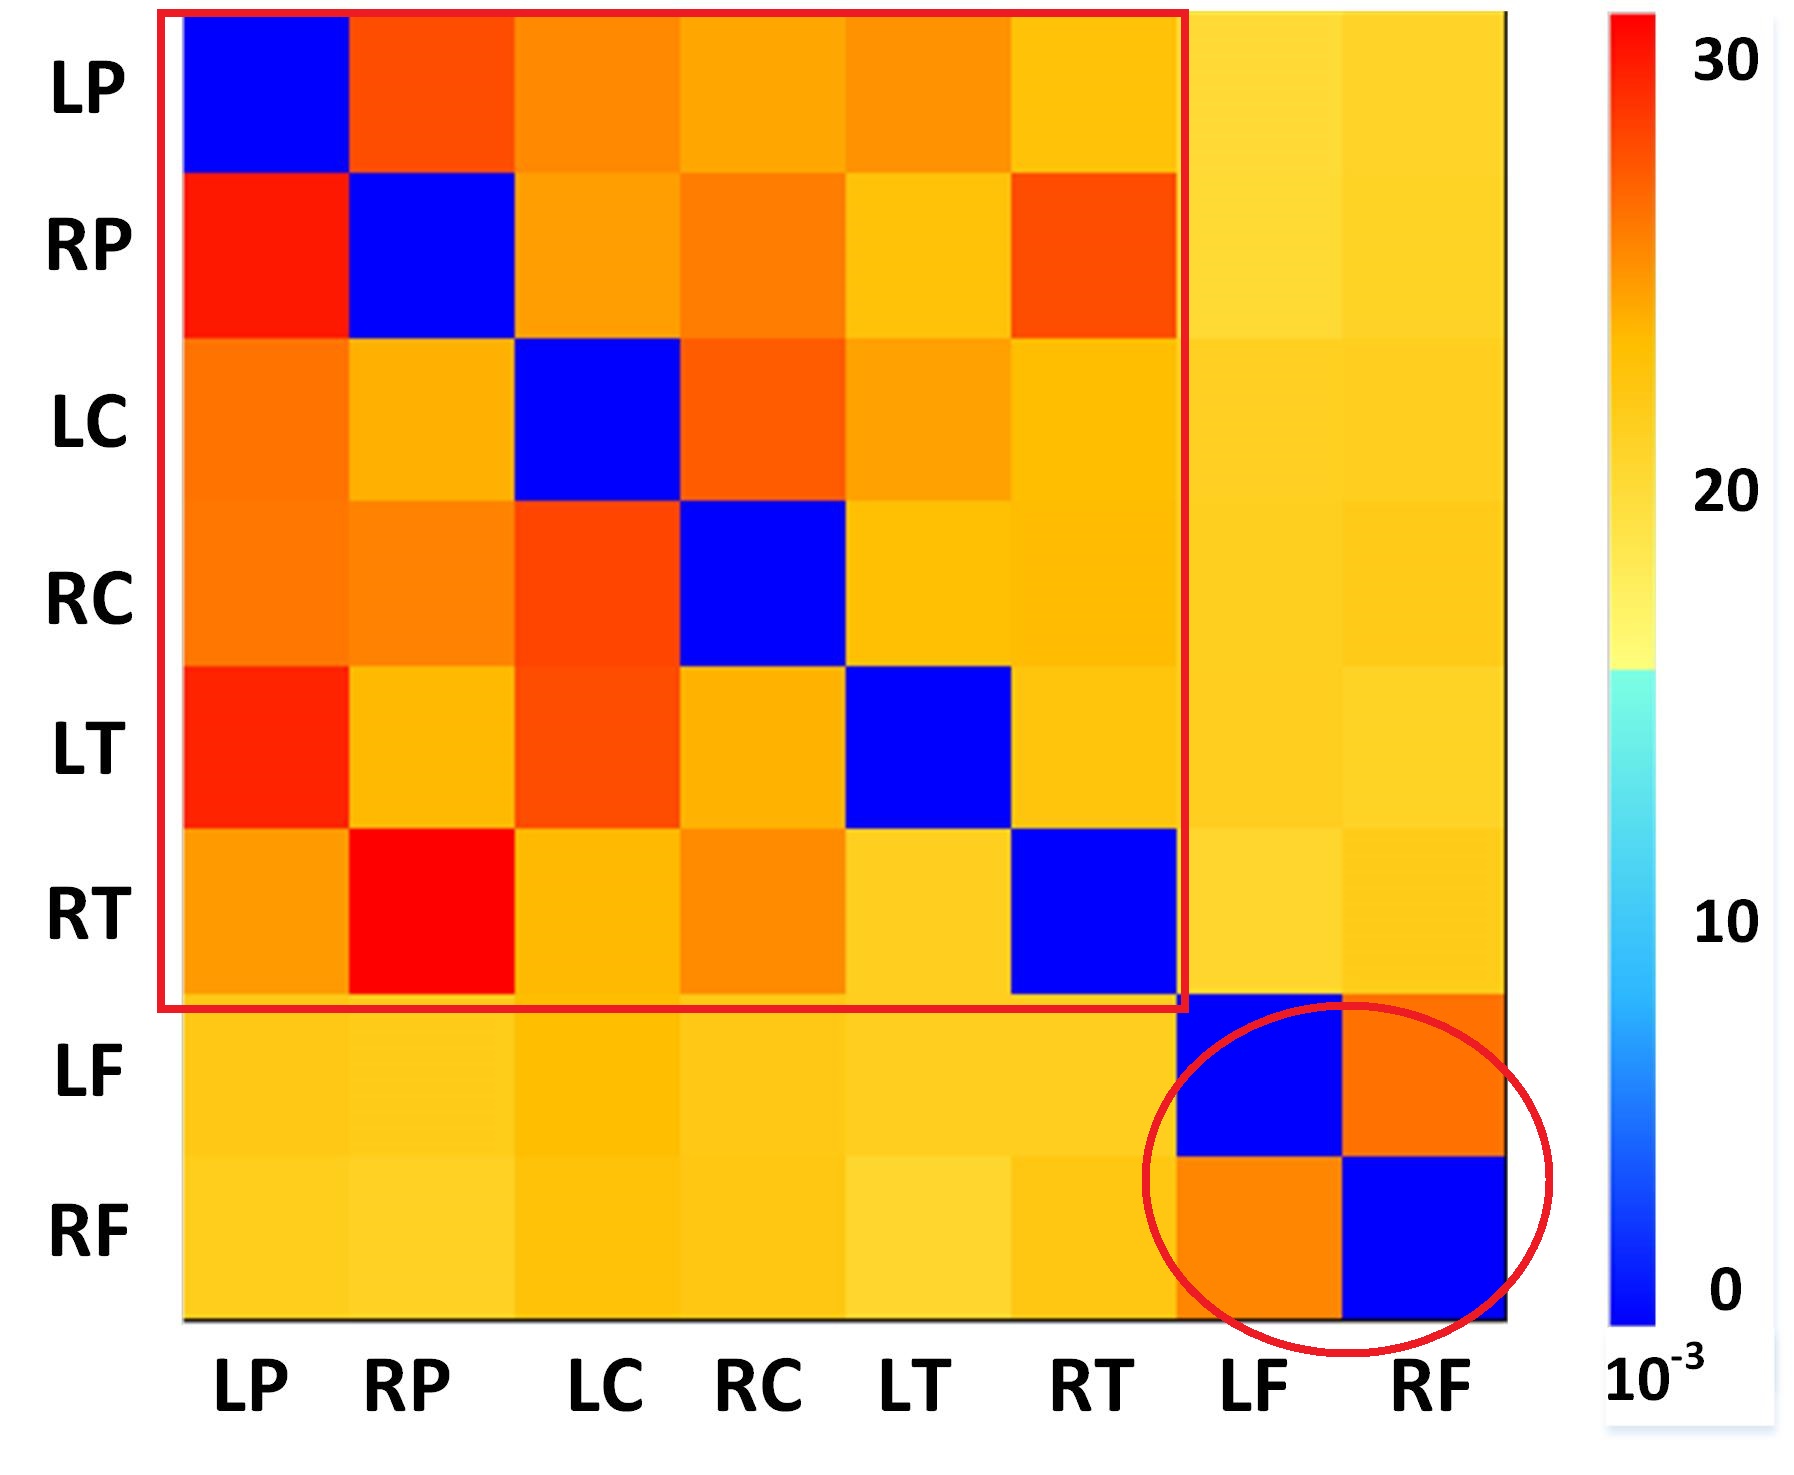
I found that if they were far apart in space, the values in their connection matrix would be very small. The connection matrix below shows that the causal connection between LF, LP and other brain regions is weak and seems to be fragmented.
Is there a problem with scouts selection? Take the left hemisphere as an example, do I need to add a scouts region of LFC between LF and LC to recalculate the Granger Connection Matrix? What is your suggestion?
@hossein27en It was decided previously that Granger causality was better estimated from concatenated trials, rather than averaging the GC of separate trials. I think that @eflorin was at the origin of this conclusion. This is why the averaging option is not available by default in the process options (otherwise it would be easy to add this option).
Please bring this question up at our next biweekly meeting.
I found that if they were far apart in space, the values in their connection matrix would be very small.
You would observe this as well with a simple correlation. The minimum norm model produces very smooth distributions of activities, the source signals are linear recombinations of all the sensors signals, ans therefore all the source signals are correlated with each other. The closer they are, the more correlated they are.
I would recommend you do not spend too much time trying to interpret the Nscouts x Nscouts matrices of GC values, or trying to compare the GC between different pairs or ROIs. The interesting result is the output of the non-parametric test: what is significantly different in these connectivity matrices between your 2 conditions.
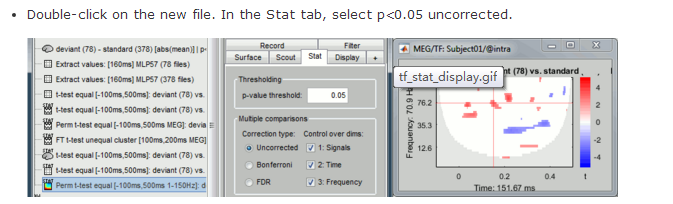
I have now completed the nonparametric test of Granger causal connection matrices under different conditions. I have a question when displaying the results: if "FDR" is chosen, there is no obvious difference between A and B, but when "uncorrcted" is selected, there will be some difference. I remember when I was doing a statistical test on source, you said that the final result must be the statistical result when choosing FDR.
Is that the same for Granger Connection Matrix? In addition, in the non-parametric test of time-frequency analysis in the Tutorial 26 about statistics, the selected item is "uncorrected".
Therefore, for the non-parametric statistical test of Granger causality analysis, whether the result of “uncorrected” selection can be regarded as the final result.
If you are doing too many tests (like in the case of a time-frequency plane), the correction might become too restrictive. This is what happens in the time-frequency example in the tutorial. A solution to go around this is issue is to limit the number of tests, or to do only one test (for example one time window and one ROI only, based on the hypotheses behind your experiment).
For your connectivity matrix, I'm not sure... How many values are you testing simultaneously?
There are 20 subjects in total. For each subject, a Granger causal connection matrix has been calculated. I am interested in the connection between two ROIs, and now there are 20 connection values (one value corresponds to one subject) under condition A. These 20 values form vector 'A'. Under B condition, there are also 20 causal connection values (one value corresponds to one subject), and these 20 values form a vector 'B'.
The paired nonparametric tests of vectors A and B are carried out.
I was asking about the number of values you test simultaneously (eg. multiple time points or frequency bins). But maybe you have only one value per subject then?
In this case, you are not doing simultaneous dependent tests, and you don't need to correct your p-values for multiple comparisons.
Note that N=20 is low, it can be difficult to obtain clearly significant differences.
Each participant had 30 trials under one condition. The time length of each trial was 5.5s. The sampling rate is 512 Hz, so the number of discrete sampling points per trial is 2816. For each trial, a Granger connection matrix was calculated. There are 20 participants. I don't know exactly how to make a statistical test on the situation of multiple participants and multiple trials, and I did the following operations:
(1) Average 30 Granger connection matrices (corresponding to 30 trials) for each participant under condition A and average 30 Granger connection matrices (corresponding to 30 trials) for each participant under condition B. In this way, for each participant, an average connection matrix is obtained under conditions A and B respectively.
(2) The paired nonparametric tests of vectors A and B are carried out as following.
If the situation is that there are multiple participants and each participant contains multiple trials, how to carry out the statistical test? Is the above method correct?
The number of trials does not matter since you average among matrices before comparison.
The number of subjects does not matter since that's your population. It is good to have a larger population but 20 should be fine.
The length of trials and sampling rate do not matter in your case, because you only consider one matrix for the entire length of the trial.
The frequency does not matter in your case since you use temporal GC, not the spectral one.
The number of pairs you wanna check their interactions does matter and determine the total number of comparisons which you should consider for correction.
So, if you want to compare conditions A and B for 20 elements of that connectivity matrix, you need to correct your p-values based on 20 comparisons.