Hello everyone,
I was wondering if brainstorm is capable of doing something that EEGLAB can, that is to plot the topography, the activity of each trial and the power spectrum density of each component, like the image that is attached to this message.
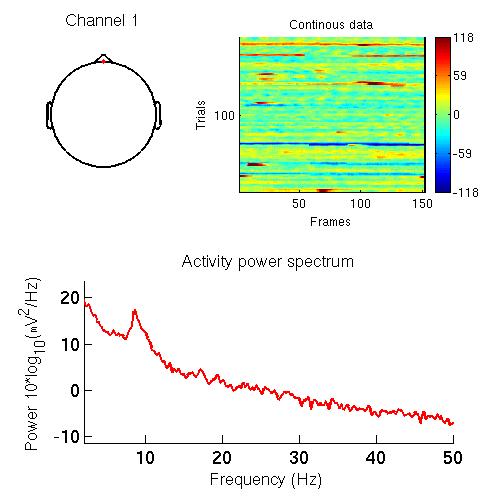
I think that the function is pop_prop().
Thank you very much
FABIO
Hi Fabio,
No this is not possible in Brainstorm yet. The support for IC time series is still very limited in the interface. There are plenty of nice features in IC analysis we could copy from EEGLAB, but we would need a developer dedicated to this for a while.
There is maybe one thing that we could think of: saving the IC time series as new files in the database (process “Apply montage”), and then processing them as regular signals in Brainstorm.
If you have the necessary skills and are interested in extending the possibilities of Brainstorm with EEGLAB functions, you’re more than welcome to contribute to the project. I could give you the entry points you need to play with the interface.
Cheers,
Francois