Issues in visualisation of single channel

Hi Brainstorm Team,

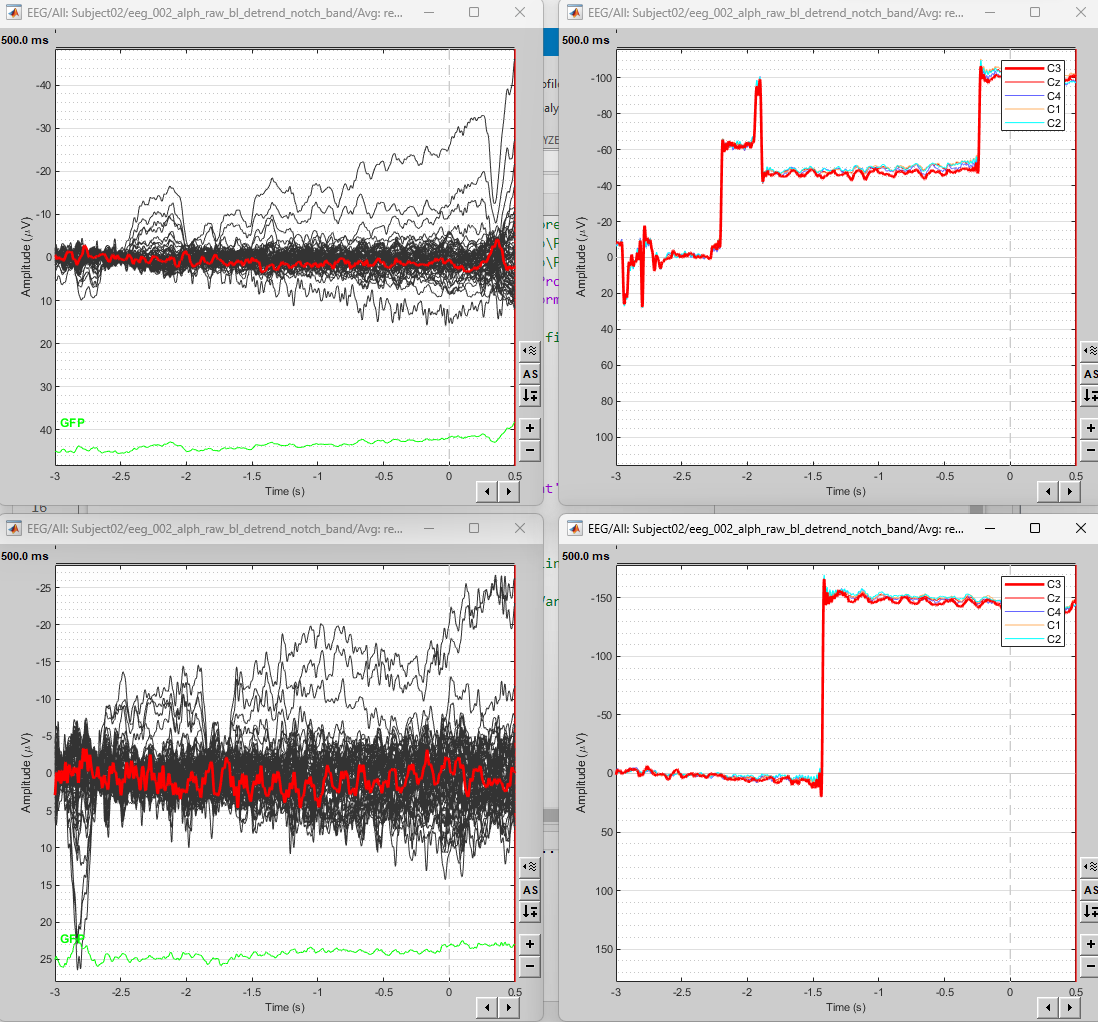
I noticed the following issue, I don't understand where it is coming from. The plot looks proper for all channel butterfly plot but for a single channel it shows these spikes/jumps.
I just tried to visualize activity of a single channel from ERP of averaged trials.

How did you extract the 5 individuals channels shown in right-hand plots?

@Heytch, verify that the montage All is selected for the butterfly plot:

https://neuroimage.usc.edu/brainstorm/Tutorials/ReviewRaw#Montage_selection

I selected the channels from the channel file and then after right click on the raw file, i chose 'view selected'.

That's how i got the plots for 5 channels out of the whole.