And How to do it?
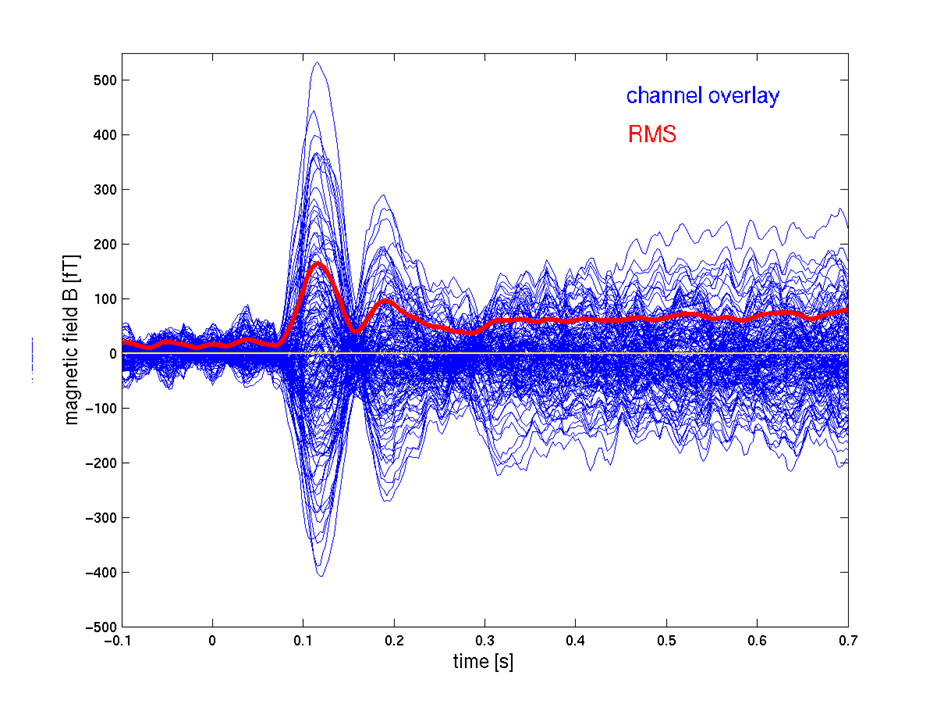
For example, I would like to have the RMS (red wave) from all the channels (see attached picture):
Charles
And How to do it?
For example, I would like to have the RMS (red wave) from all the channels (see attached picture):
Charles
Oh you mean average all the channels together, not average all the subjects together.
You should already have a green line called “GFP” at the bottom of the figure, as illustrated in this tutorial:
http://neuroimage.usc.edu/brainstorm/Tutorials/TutRawAvg#Explore_the_sources
GFP = global field power = sqrt(sum(channels.^2)) = RMS
If you don’t see it, check the Brainstorm preferences > check “Display GFP over time series”.
Perfect!
Yes I have the GFP line in the figure. I was wondering why this global field is at the bottom and not around Zero as showed my previous picture? Also, there is a way to import this line in Matlab if I would like extract the numerical value of the peak?
The line displayed in this figure doesn’t show the real values, you should re-calculate this instead.
Right-click on your data file > File > Export to Matlab > “DataMat”.
GFP = sqrt(sum((F(iMeg,:).^2, 1));
iMeg is the list of MEG sensors. To extract it easily, right-click on the channel file > File > Export to Matlab > “ChannelMat”.
iMeg = channel_find(ChannelMat.Channel, ‘MEG’);
Super!
Also, I would like to know if there is a way to export the data to Matlab automatically for all my participants by conditions between pre and post sessions and not to do it manually for each participant by Right-click on my data file > File > Export to Matlab > "DataMat".
I would like to have a matrix sensor/time and find the maximum amplitude from my P50, N100 and P200 waves...
Do you have a tool to do that automatically from my protocol?
Thank you,
Charles
You can load the data directly from a script.
% To get the contents of one folder:
sStudy = bst_get('StudyWithCondition', 'SubjectName/Condition');
% Loop on the files
for i = 1:length(sStudy)
    DataMat = in_bst_data(sStudy.Data(i).FileName);
end
The line displayed in this figure doesn’t show the real values, you should re-calculate this instead.
Right-click on your data file > File > Export to Matlab > “DataMat”.
GFP = sqrt(sum((F(iMeg,:).^2, 1));iMeg is the list of MEG sensors. To extract it easily, right-click on the channel file > File > Export to Matlab > “ChannelMat”.
iMeg = channel_find(ChannelMat.Channel, ‘MEG’);
Hi Francois,
I'm trying to obtain a GFP graph from my data. I used your formula but something is not working. What is the "F" function or variable? How should i rewrite your formula so to obtain a GFP graph? I tried to write something different:
iMEG=channel_find(ChannelMat.Channel, "MEG");
GFP=sqrt(sum((F(iMEG,:).^2))
But Matlab returns me a single value (3.2971e+03). I don't understand if this value is fine or I should have a matrix or something else that I can plot over time. Just to clarify, I am working with a file that is AVG B - AVG A (MMN task, B=deviant tone, A=standard tone).
Thanks for the help
What is the “F” function or variable?
The field F from the data file structure, which contains the MEG recordings:
https://neuroimage.usc.edu/brainstorm/Tutorials/Epoching#On_the_hard_drive
How should i rewrite your formula so to obtain a GFP graph?
sum(A^2, 1): sums the squared values from a matrix A along the first dimension (in Brainstorm: the channels)
sum(A^2): does exactly the same, dimension #1 is the default dimension in Matlab
GFP = sqrt(sum of the square across all the channels)
If you are not familiar with Matlab at all, you should probably start reading some tutorials about Matlab script and matrix indexing.
Here is where it is computed and displayed in Brainstorm: