Hi,
We ran a PSD on 2000 vertices. We now want to map these 2000 values obtained from the PSD onto a cortical map. We would like to represent the values with colour (i.e., a heat map). Do you have suggestions on how to do so?
Thanks,
Hi,
We ran a PSD on 2000 vertices. We now want to map these 2000 values obtained from the PSD onto a cortical map. We would like to represent the values with colour (i.e., a heat map). Do you have suggestions on how to do so?
Thanks,
Did you compute the PSD with Brainstorm? If yes, the display is straightforward by just double clicking on the PSD file. If from outside Brainstorm, I suggest you compute one using Brainstorm, to create a PSD file in the database which you can then populate with your own PSd value using the File > Export to Matlab, then File >Import from Matlab once of you have replaced the PSD values.
Let us know how this goes.
Hi Sylvain and thanks for your help.
We did compute the PSD with Brainstorm. However, double-clicking on the PSD file opens a graph. What we want, rather, is to display or project those PSD values on a 3D brain map such as available through the anatomy tab. Although the option to export data from a displayable brain (in the functional data subject tab) is available (here, MN: MEG(Constr)), importing is not. In sum, we would like to end up with six brain maps, one for each six frequencies. This is just a way to visualise our data—specifically, which vertices were activated on the brain, and with what magnitude.
OK thanks.
What happens when you right-click over the PSF file: do you see a menu item indicating that you can display on a brain surface?
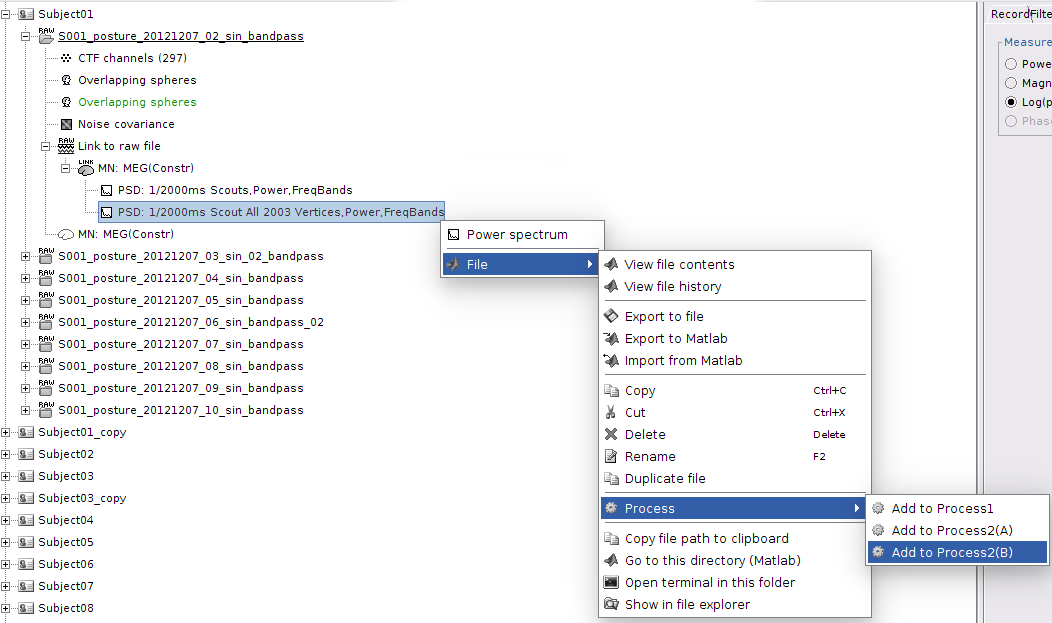
No, I don't see a menu that offers to display the PSD values on a brain surface. Please see attached screenshot for available options.
This is what we would like to do:
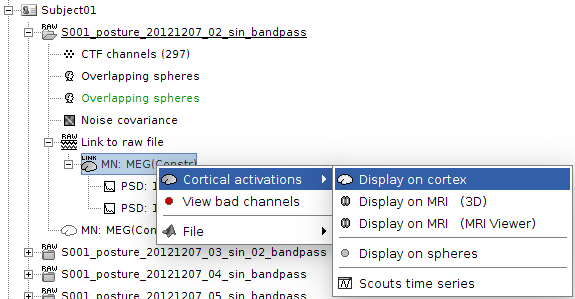
Looks like you computed the PSD on scouts. To show PSD values on entire cortex, you need to let the computation go w/o selecting scouts when launching the process. Hope this clarifies.
True, thanks for pointing that out. However, proceeding as such leads to the following error message:
We've tried changing the process options to Epoched rather than Continuous, but we still get the same error. We also tried Import in database on Link to raw file but the resulting file doesn't accept PSD computation.
Hi Remi,
As the error message says, this operation is not supported for continuous recordings.
If you want to run this operation: import a large block of recordings from this continuous file (right-click on the link > Import in database) and run the PSD on it.
If you get out of memory errors, you can alternatively import chunks of 1s or 2s (use the option “Split in time blocks”) and the run the process “Frequency > Fourier transform (FFT)” with the option “Save average power”, the results will be similar.
Cheers,
Francois
Hi Francois,
Thanks for your help. With your help we were able to compute PSD and display the results on cortex like we wanted. We were trying to compute the PSD directly on the Raw file rather than computing sources first. That fixed it.
Cheers,
I have computed source first before computing the PSD directly on the RAW file but still I could not display the PSD results on cortex. Right clicking on the computed source allows me with an option to display on cortex. However, this is not possible with available PSD file generated after power spectrum analysis. I also tried importing the data even then the same difficulty of displaying it on cortex is persistent.
Even Project on Default anatomy:surface also throws up an error "Only cortical maps can be projected"
Kindly advise what might be the problem
Thanks and Regards
Himanshu
You are probably computing the PSD of the recordings, not the PSD of the source maps.
Don't forget to click the button "Process sources" in the Process1 tab, or to select directly the source maps in Process1.
See this tutorial for step-by-step instructions:
https://neuroimage.usc.edu/brainstorm/Tutorials/RestingOmega#Power_maps
If this comment doesn't help you, please post some screen captures to better explain you issue.
Thanks Francois,
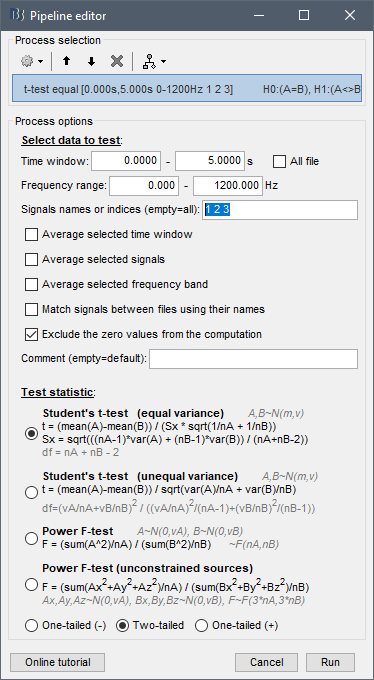
Indeed it worked when we used source maps for PSD computation. While running permutation statistics (paired t test) the error is "cannot select rows in source maps". However parametric testing does not gives this error and displays the results.
Please comment what is the error "cannot select rows in source maps" indicating while performing permutation statistics.
Regards
Please comment what is the error "cannot select rows in source maps" indicating while performing permutation statistics.
You get this error message probably because you entered something in the option "signals names or indices". When computing averages or other statistical measures on full source maps, you must keep all the data available in order to keep the data structure coherent. Otherwise, the results would not be displayable on the cortex surface anymore.
You don't have this limitation when working with ROIs. You can perform your test on any number of scouts. The results can't be displayed on the cortex surface anyway.