Hello Again,
Sorry for asking so many questions, but I am finally getting somewhere with my project and working with brainstorm is very pleasant.
My Question is:
What function in MATLAB corresponds to showing/observing the projected result on the surface for the case of Simulated signals
I know that for estimation of inverse problems, i.e sloreta result , Line 1961 of bst_memory.m is responsible for multiplying L^{+} by M to get J. which is
ResultsValues = ImagingKernel * Data;
Now I am looking for the same code but for simulating data. In what .m file/line does ImagingKernel gets multiplied by Data for the case of Simulated signals (True Output). I know it is not the same bst_Memory because changing mentioned line doesn't change the output of simulated signals.
In the case of this simulation of EEG recordings, the source files you get in the database are created directly, they are not the result of an inversion process. The variable ImageGridAmp is set to zero, and only the vertices in the scouts corresponding to a signal in input are set to non-zero values. This is done here:
Then this synthetic source maps are multiplied with the forward model to get EEG recordings, and finally noise is added:
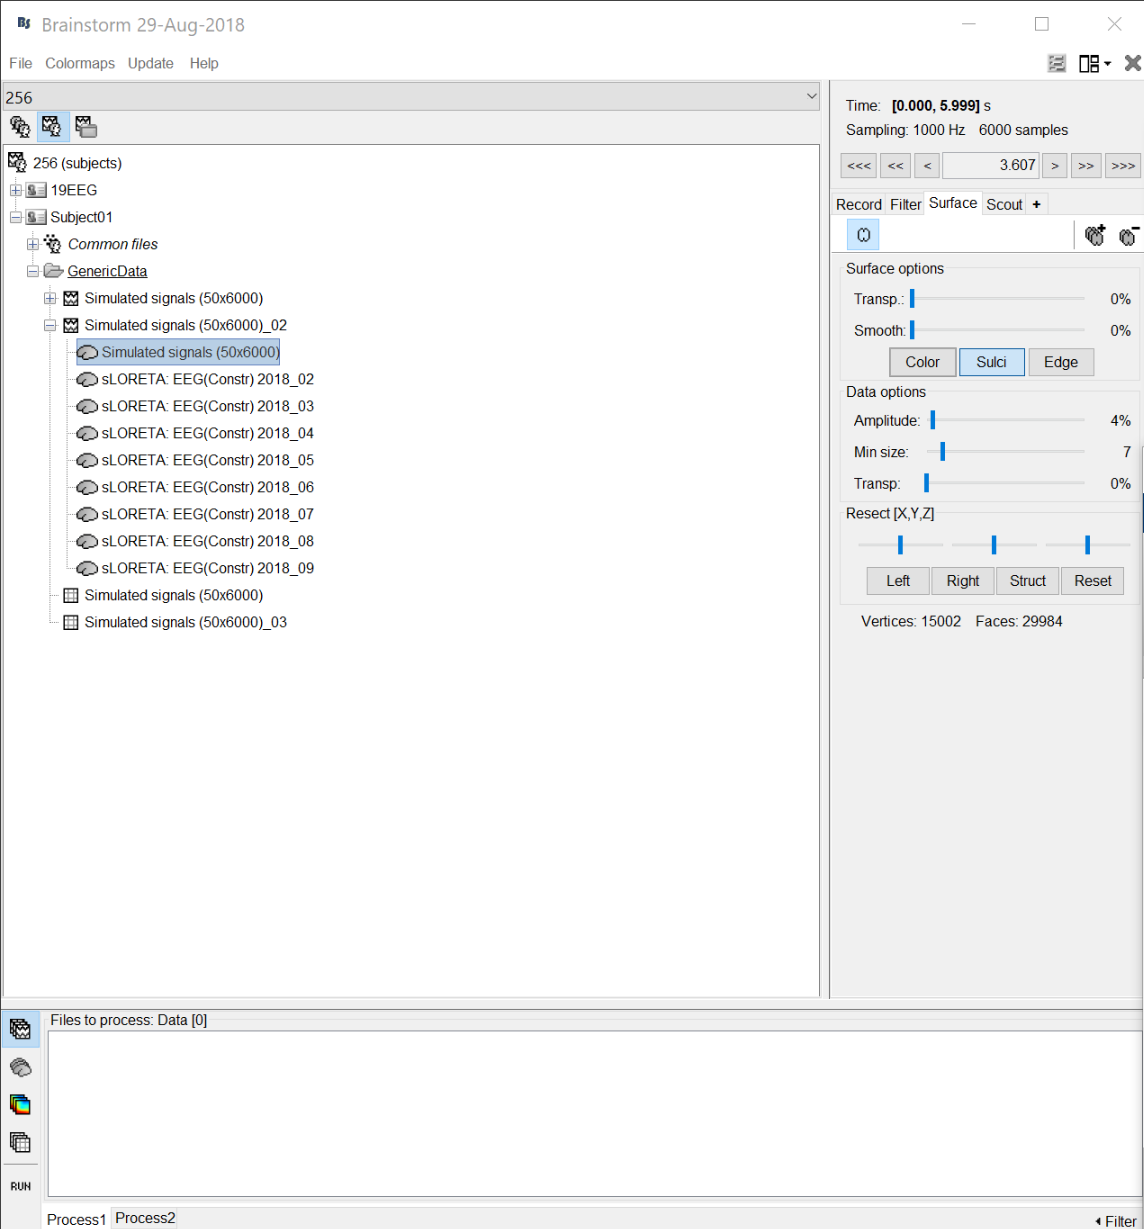
Would you mind also showing me where amplitude thresholding of sLORETA and inverse models, in general, take occur in the code? (Where can I in the code set the threshold, rather than increasing the bar manually after?)
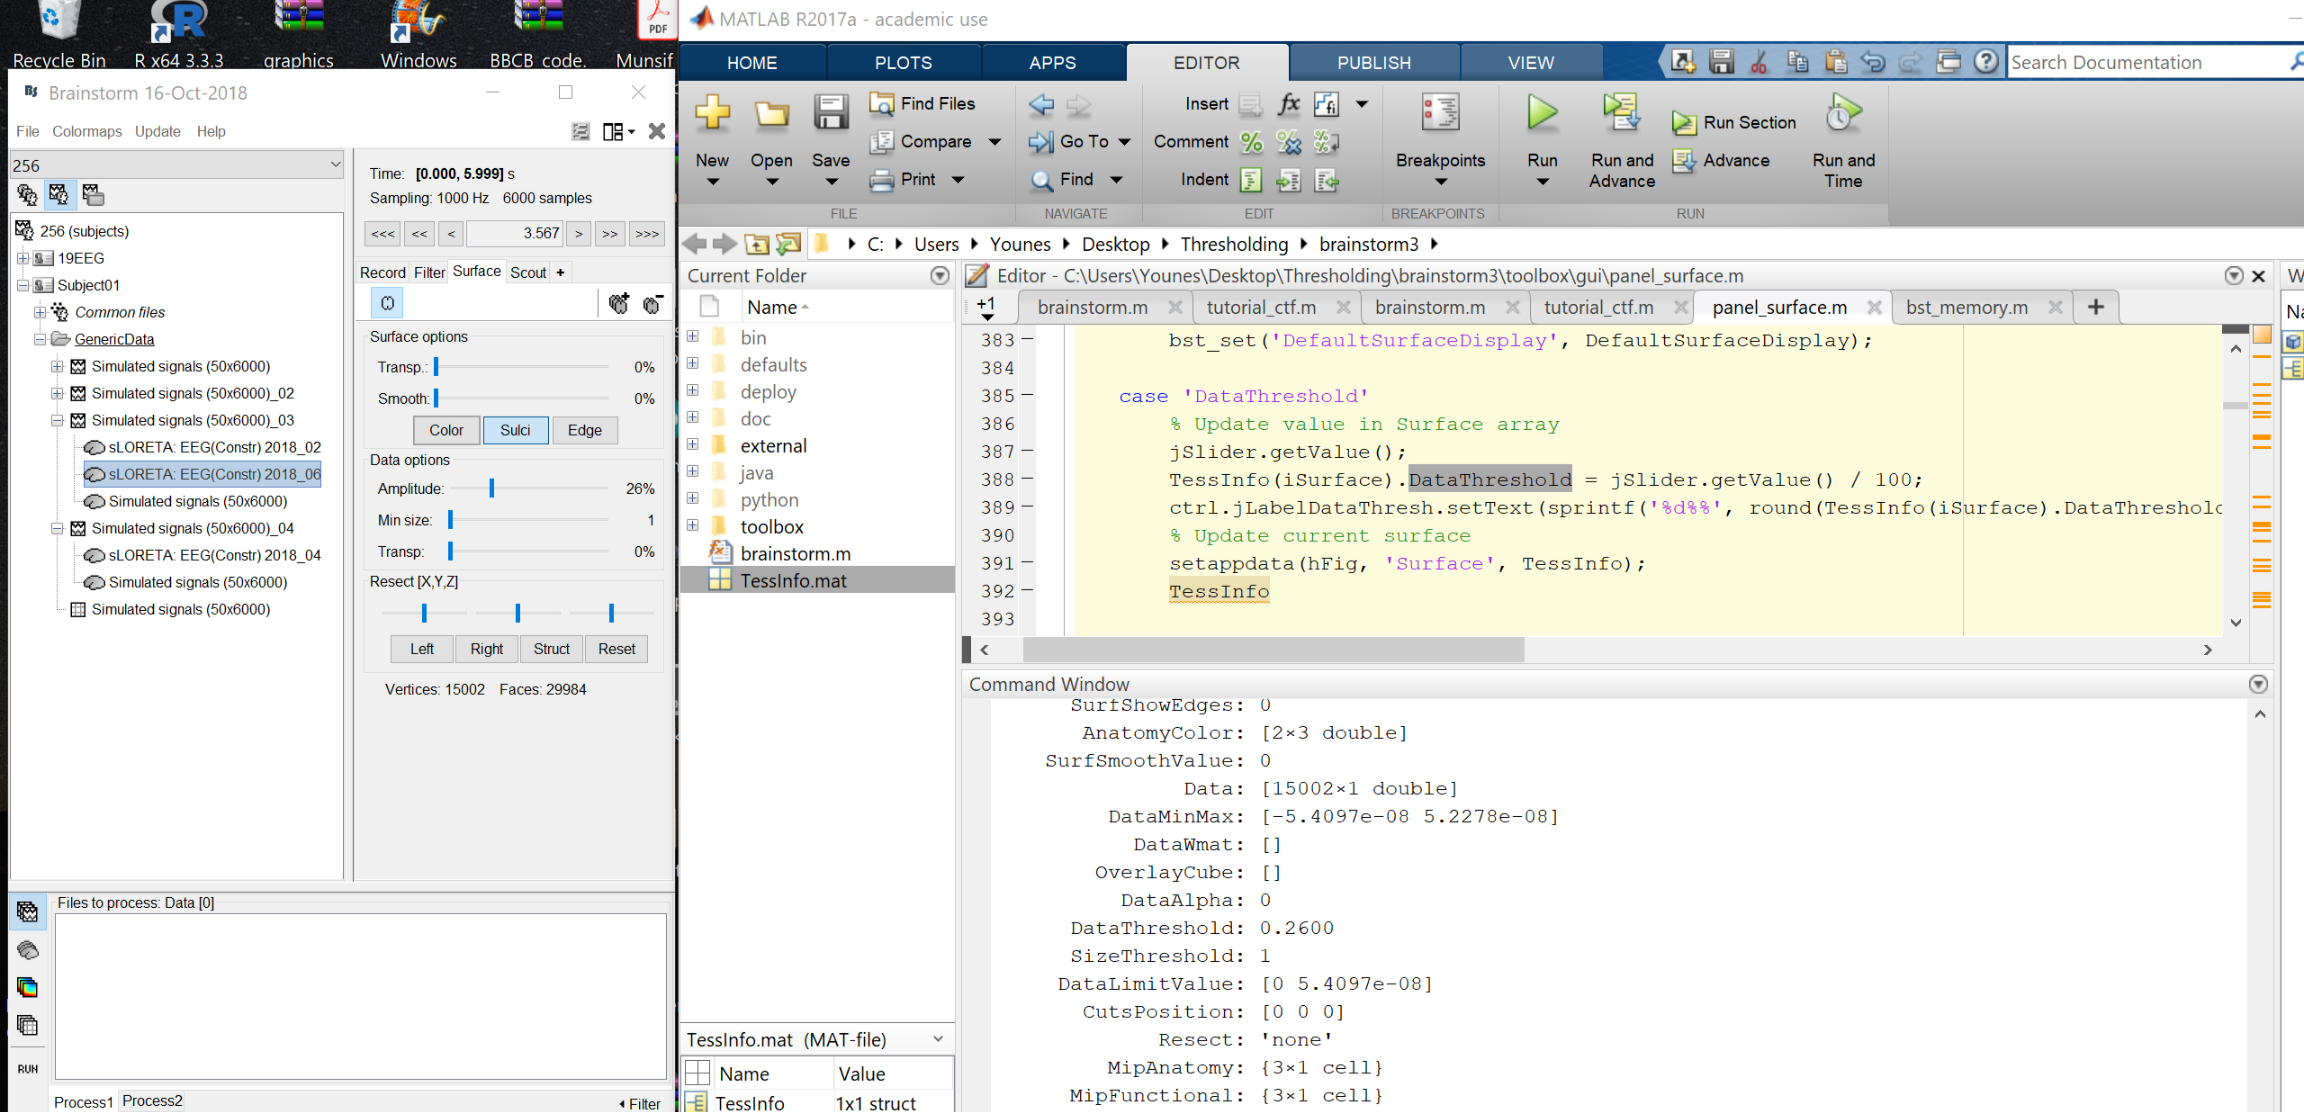
So based on the figure above, it seems like we are getting the threshold, updating TessInfo(iSurface).DataThreshold data and then setting the figure hFIG with the new threshold.
What I dont understand is how Threshold and threshold size change the figure. Do they change the grid value/size? do they make values bellow threshold zero for the J? I am not able to see where does the changes occur? I am interested to see what exactly DataThreshold and ThresholdSize do to the output right before it get plotted? What is function that work with DataThreshold and ThresholdSize to update the output?
Thank you so much
Best
Hello,
If you are going that deep in the code, the best is that you explore the code yourself.
Two useful tools in Matlab you may need for this task:
The debugger: put a breakpoint by clicking in the margin next to the line number, run the execution by manipulating the Brainstorm interface, then when the debugger stops, explore the variables and follow the execution of the code line by line. You can find tutorials and videos explaining how the debugger works.
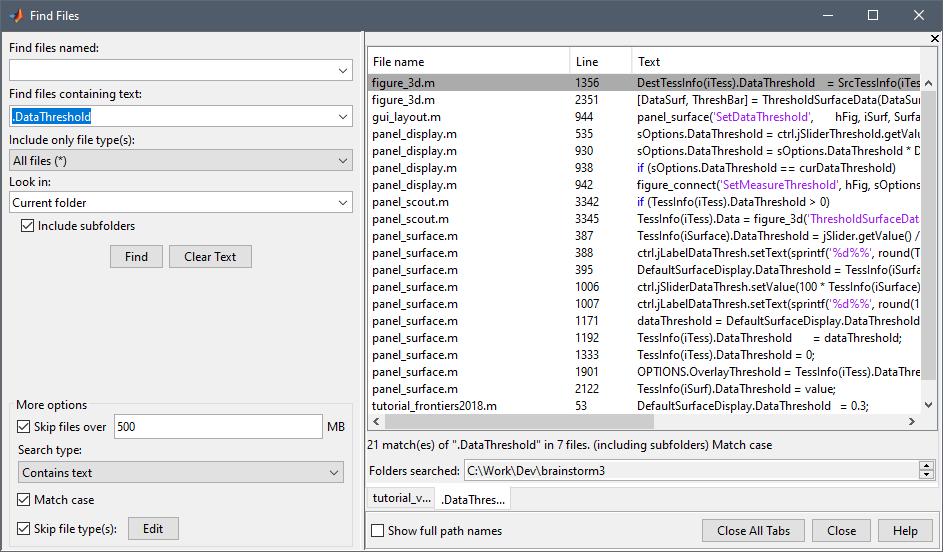
The button "Find files" in the "Home" tab: go to the brainstorm3 folder, check the option "Include subfolders", and search for ".DataThreshold" to check all the places in the code that use this field - this is how you will find how it effectively used for updating the display (in function "ThresholdSurfaceData" in figure_3d for instance)