Dear @Francois
Thank you for your respond, I understand that using panel_surface we can update the threshold.
I dig into Panel_surface and saw the following:
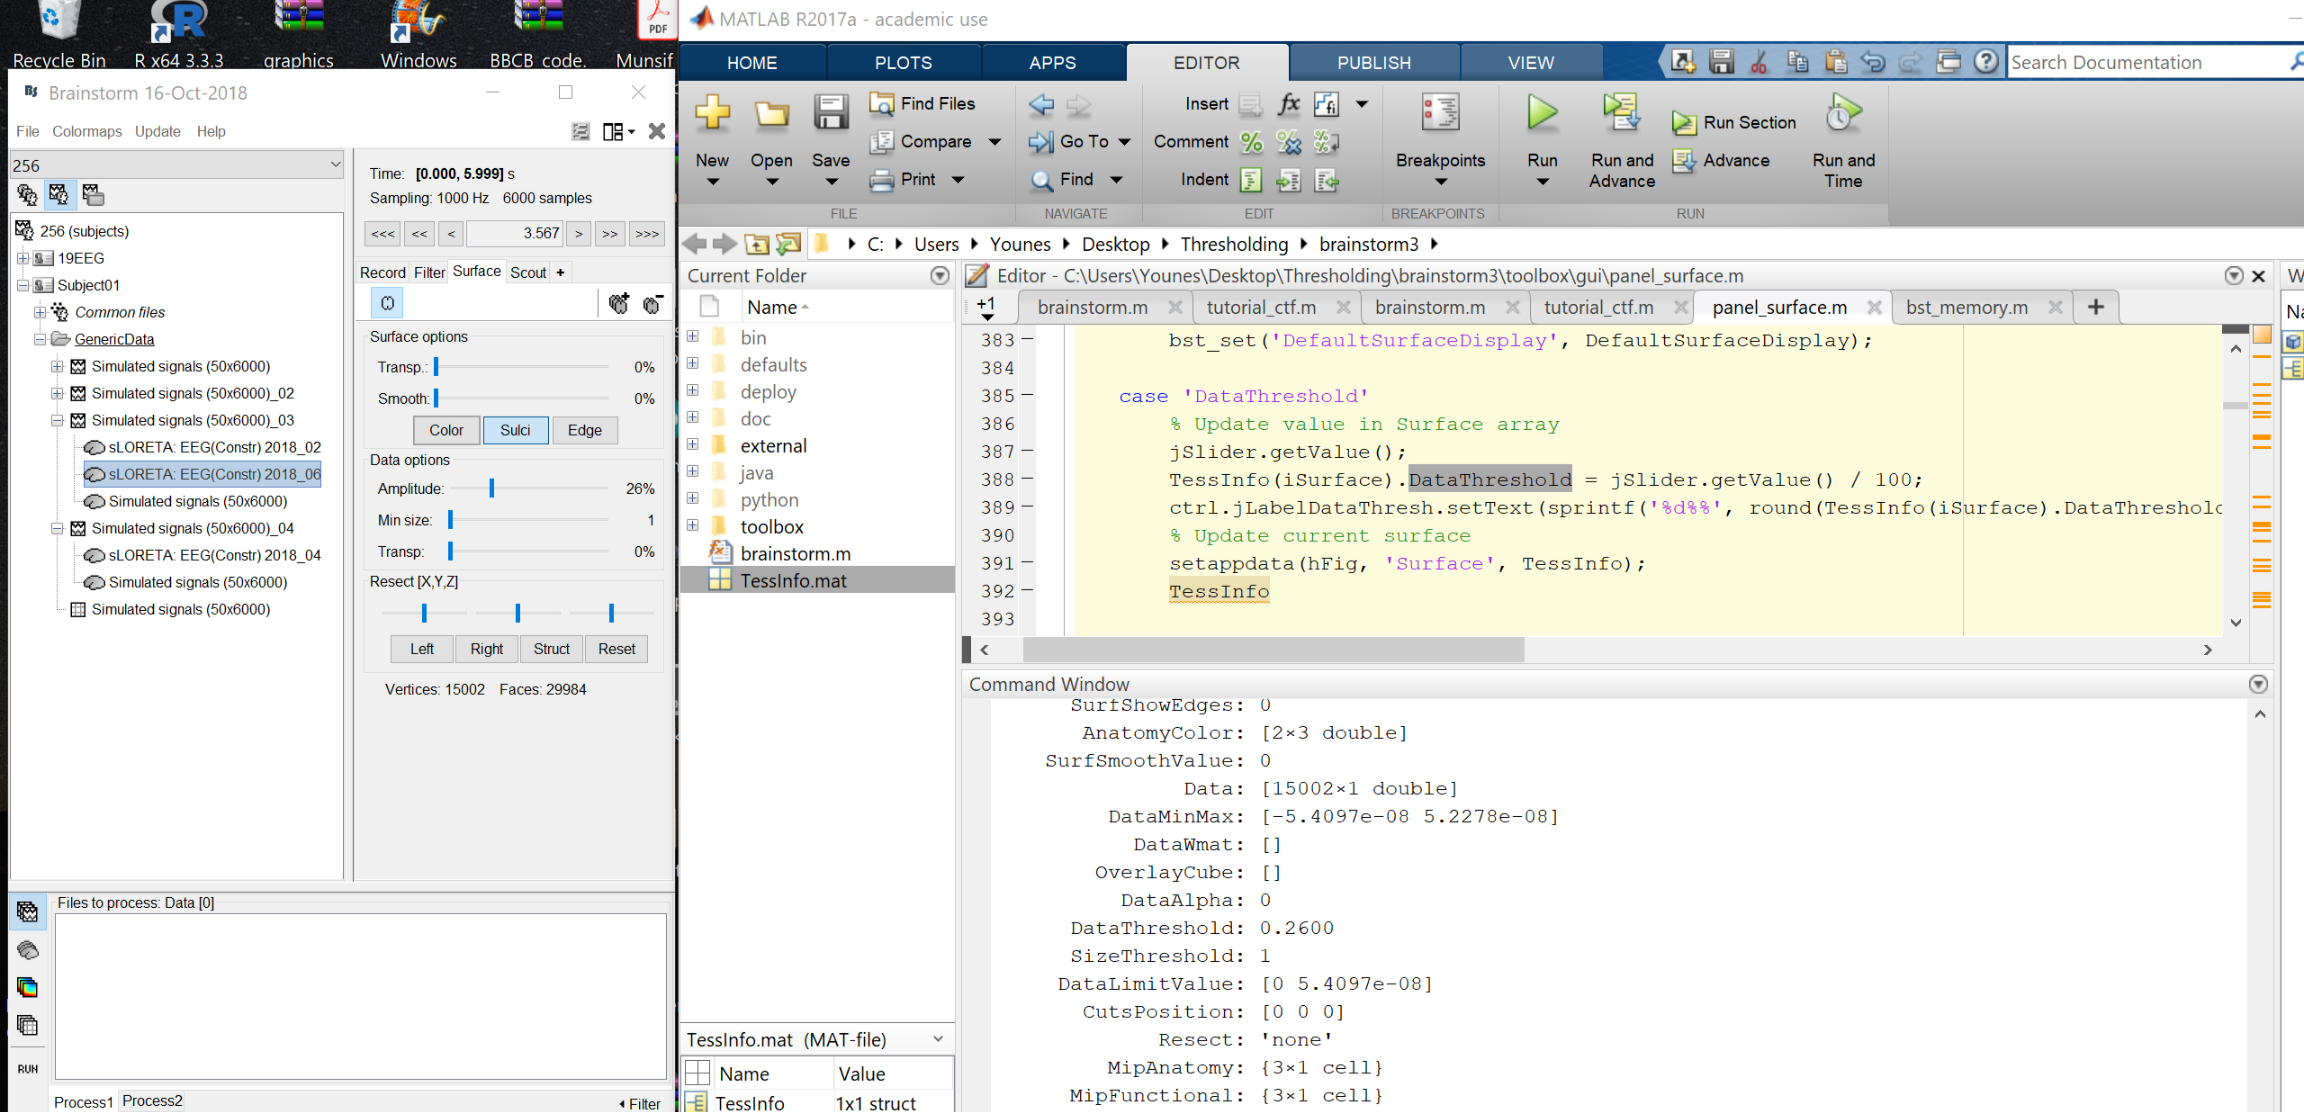
So based on the figure above, it seems like we are getting the threshold, updating TessInfo(iSurface).DataThreshold data and then setting the figure hFIG with the new threshold.
What I dont understand is how Threshold and threshold size change the figure. Do they change the grid value/size? do they make values bellow threshold zero for the J? I am not able to see where does the changes occur? I am interested to see what exactly DataThreshold and ThresholdSize do to the output right before it get plotted? What is function that work with DataThreshold and ThresholdSize to update the output?
Thank you so much
Best