I have a little issue I could please use some help with.
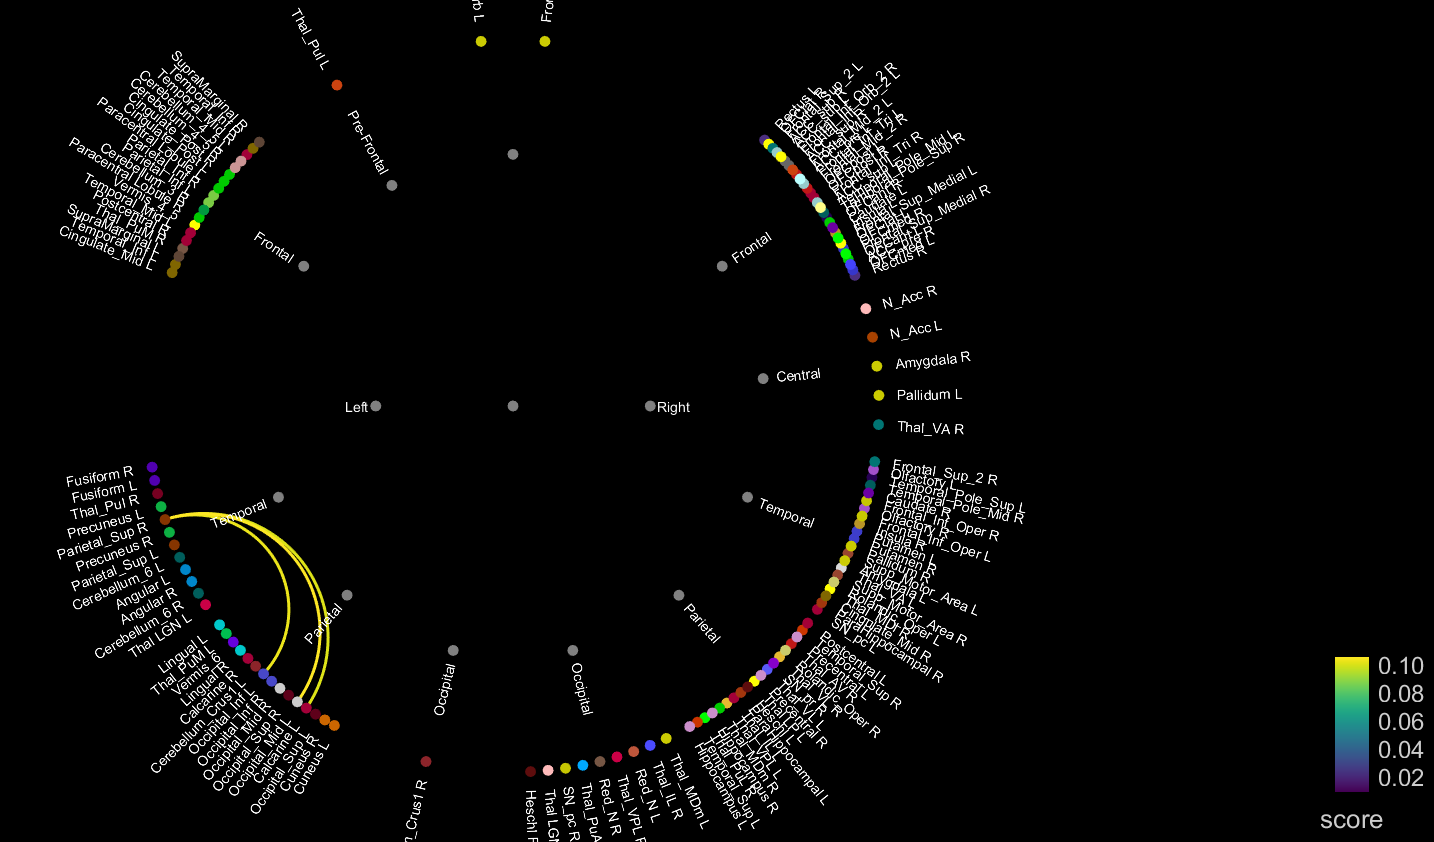
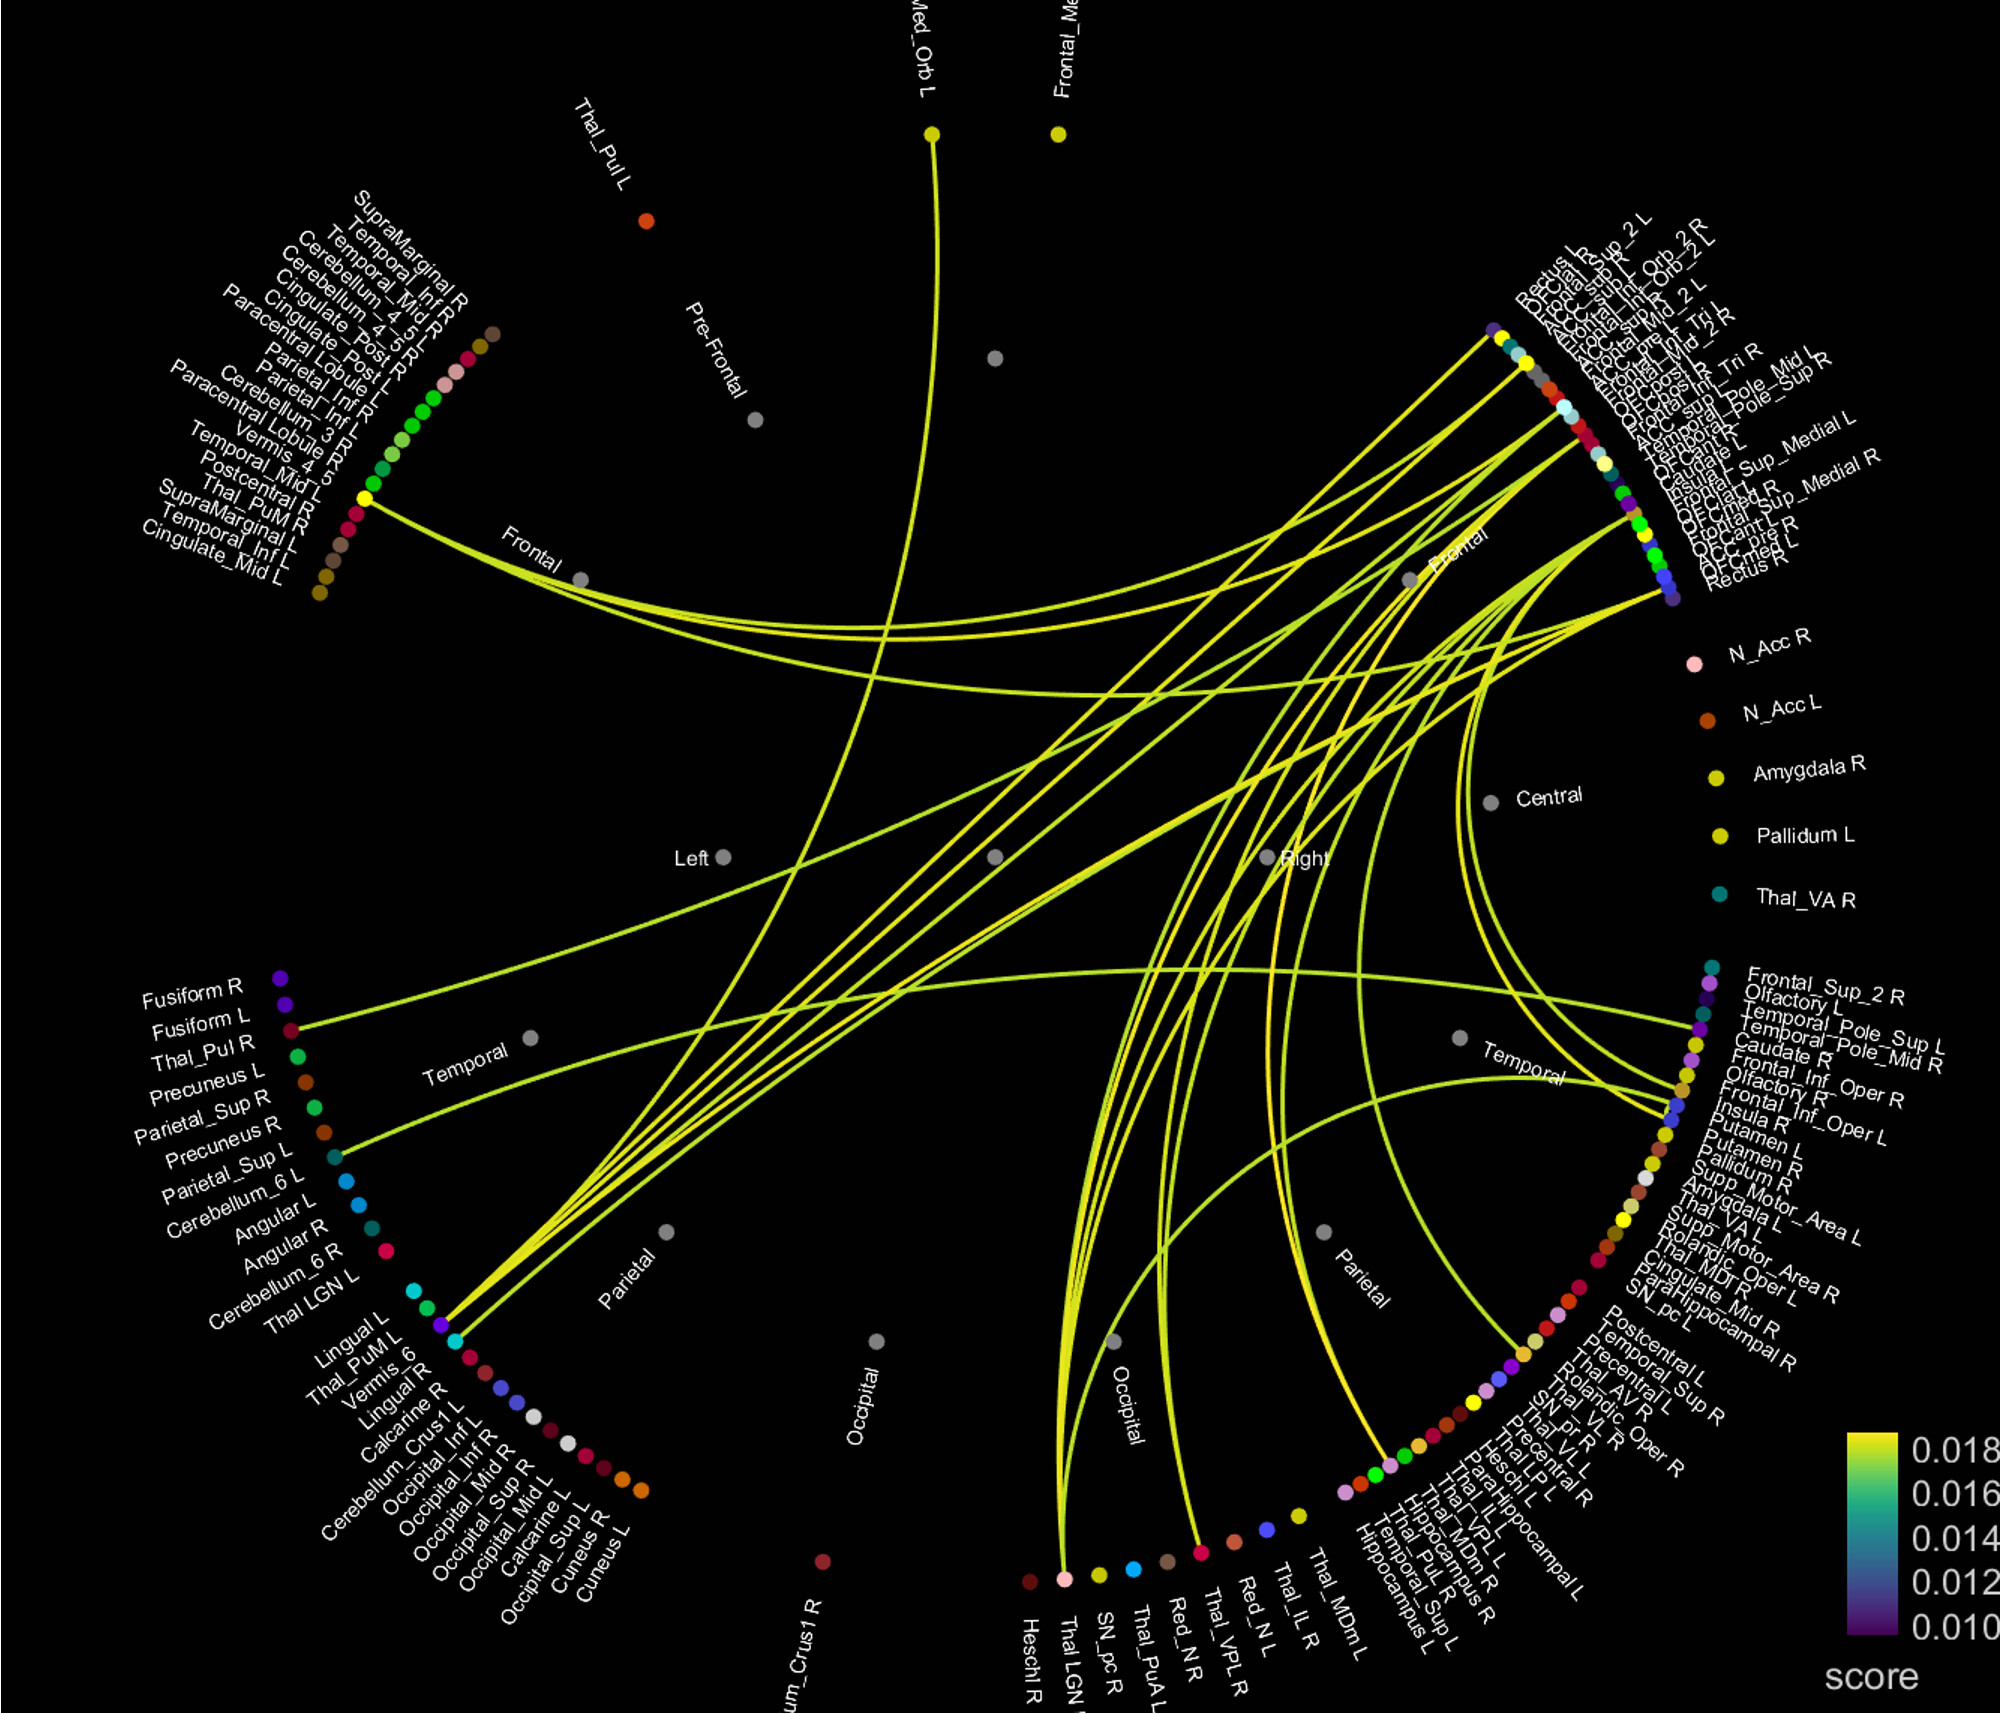
I'm attempting to insert a connectivity matrix of dimensions [133x133] back in Brainstorm, where I'd like to visualize it as a graph as I know this is a feature of the software. I imagine it looking like below:
The matrix I am using is an exported and Matlab-processed version of a connectivity matrix previously obtained in Brainstorm using the AAL3 parcellation having 133 scouts.
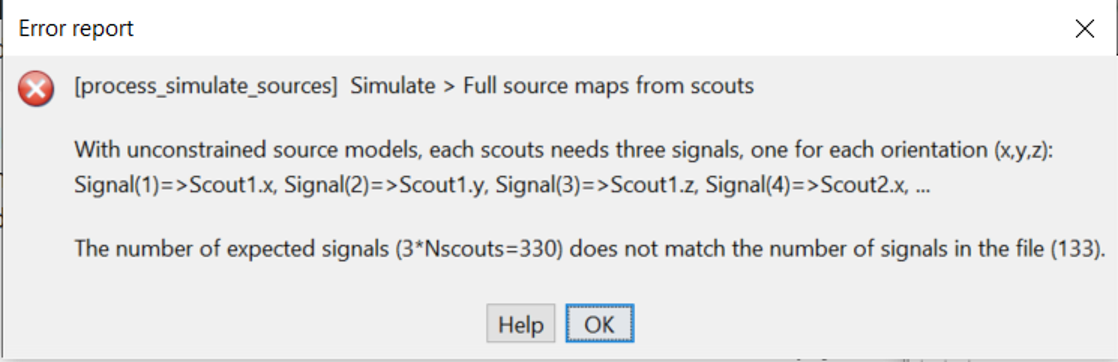
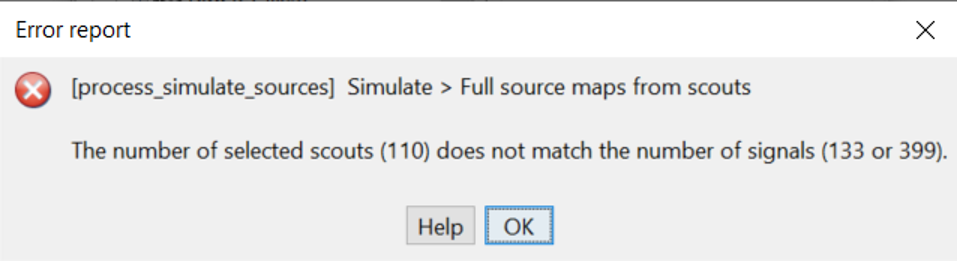
To do this, I've been following this great answer for a similar Brainstorm issue: Connectome viewing - #6 by Francois. I have been able to follow it until reply 6, inclusive. At this point all seems to be good as I already have a channel file and head model. However, I run into the following issue: the number of head model scouts seems to be incompatible with the number of signals of my matrix, for both unconstrained and constrained models:
This is despite the fact that I've selected the AAL3 as the MRI template for the analysis.
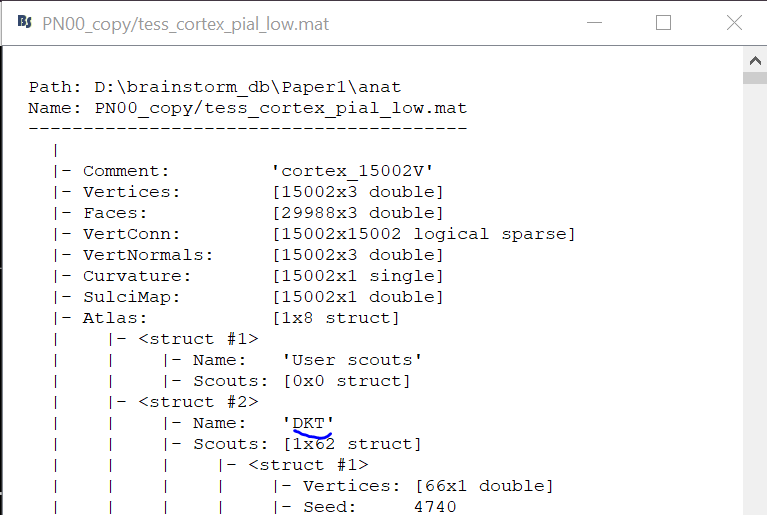
And then I realized that the head model (the cortex file, more precisely) I use is built onto a DKT parcellation (having 110 scouts), as shown below:
Is there any way I overwrite the parcellation the MRI template is built onto? Or do I have to find a different MRI template? And also, is my goal possible - that of plotting a graph from my matrix?
I have difficulties understanding what you are trying to do, as it mixes multiple topics.
If you want to display a 133x133 connectivity matrix as graph:
Start by computing a similar file with the appropriate scouts from Brainstorm (133x133) - it seems that this was your starting point
Right-click on the connectivity file > File > Export to Matlab > "FileMat"
Replace the FileMat.TF field computed from Brainstorm with the connectivity matrix you want to visualize: your matrix must have exactly the same dimensions.
For this, you might have to compress or uncompress the matrix. See the forum posts listed here for help: https://neuroimage.usc.edu/brainstorm/Tutorials/Connectivity#Additional_documentation
Set the file comment: e.g. FileMat.Comment = 'your comment';
Right-click on the folder > File > Import from Matlab > "FileMat"
Apologies for the complicated way I presented my issue, and thank you so much for your answer.
I followed the steps you outlined, thus managing to import my data in the format Brainstorm uses. However, I still can't plot my matrix (Eigen1_delta) as a graph:
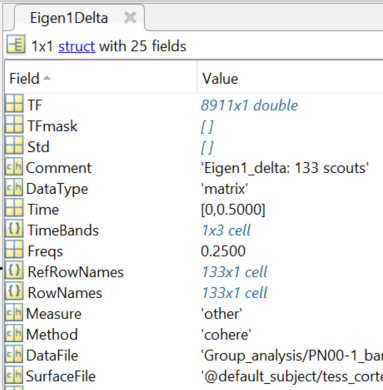
In Matlab, the struct looks like this now, after I've changed the TF field (and others such as frequency, since I have only one matrix and I don't care about the frequency):
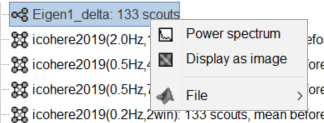
I followed the steps you outlined above as much as I understand but still I cannot plot the connectivity matrices as graphs. Indeed, they don't seem to be recognised as graphs.
Instead, I can plot only them as figure or power spectrum.
Do you have any idea what might be missing from my imported data in order to have it behave exactly as the connectivity obtained in Brainstorm?
These files are 1xN connectivity results.
To get the graph option available, you need these files to be registered as NxN.
If you can't get the files to be imported as NxN with the menu Import from Matlab when right-clicking on the FOLDER, try doing it on right-clicking on the original NxN file (it will replace it instead of creating a new one).
Alternatively, save it directly as a .mat file in the correct folder and reload your protocol.
Just one more thought on this: for some reason, the parcels don't seem to be arranged correctly in the figure. For example, not all the right hemisphere parcels are on the right side of the graph - some are on the left (and the other way around for the left parcels). This can be seen from the parcels labels in the figure below. Is there something I could do to solve this issue?
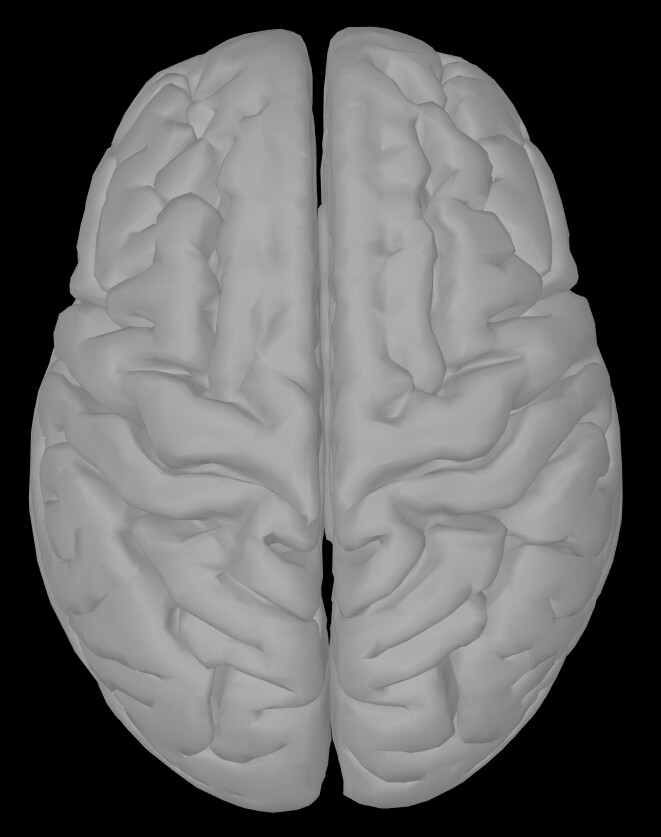
This might be dues to the anatomy not being oriented correctly.
Can you please post a screen capture of what the cortex surface looks like when you double-click on it (without rotating the view)?
I can't reproduce this behavior on my end.
Can you please share an example dataset?
Duplicate the subject (right-click on the subject > File > Duplicate)
Delete all the unnecessary files:
In the anatomy: keep only the MRI, the head surface, the cortex surface you used for the computation
In the functional data: keep only one folder containing one channel file + one data file + one source file + one connectivity result associated with this source file
Right-click on the subject > File > Export subject
Test your package:
Menu File > Load protocol > Load from .zip file, select the .zip you've just created (e.g. "ProtocolName_SubjectName").
This is an exported Brainstorm protocol with one patient, whose brain model is co-registered for group analysis. I selected the file I'm referring to in the screenshot below. This is the 'Group analysis' connectivity that is not plotted correctly.
The .zip file can be found here: Paper1_PN07_copy.zip - Google Drive. For some reason I couldn't load it in Brainstorm while archived, but it worked after extracting the files.
Please let me know if I can provide anything else, and thank you so much for all the help!
For some reason I couldn't load it in Brainstorm while archived, but it worked after extracting the files.
It worked for me.
Either you already have a protocol with the exact same name in your database, or you do not have the write to create the folder Paper1_PN07_copy in the folder that is currently used as your "database folder".
(to see what this is, you can execute: bst_get('BrainstormDbDir'))
Please let me know if I can provide anything else, and thank you so much for all the help!
I found the bug... When creating the scouts from the AAL3 volume parcellation, it was trying to detect the lobe with a function working only for surface parcellations... You can see that in the scout tab, most scouts have their region that is incorrectly detected (the two letters at the left of the scout name).
I disabled this, and it seems to work already better. Now it should only show "L" or "R" in the Scout tab.
You need to create the atlases again and compute the source results again. Update Brainstorm to get the fix.
There is one issue though, that it would take me quite some time to redo the analysis. Is there any workaround to this issue (to get the right labels without recomputing the atlases and the source results?
Another very important question is whether the assignment of voxels in the model should be correct despite the labels being incorrect? From what I checked, the voxels are correct but I want to confirm.
There is one issue though, that it would take me quite some time to redo the analysis. Is there any workaround to this issue (to get the right labels without recomputing the atlases and the source results?
With these new changes I made, it's going to be complicated to edit the file structures.
You'd need to:
delete the atlas and recompute it (changes the Atlas field in the surface file)
copy the field GridLoc from the source file to the connectivity file
in the connectivity file: edit the Atlas.Name field to match the name of the atlas that you used for the computation
It's probably easier for you to simply recompute these files...
I confirm that the classification of the scouts in anatomical regions was incorrect (causing display issues in the connectivity graphs) but that the connectivity matrix is correctly computed.