NIRS: Inconsistent sampling frequencies

Hi @edelaire @Francois, and team!

I am wondering if you can help me in my analyses.

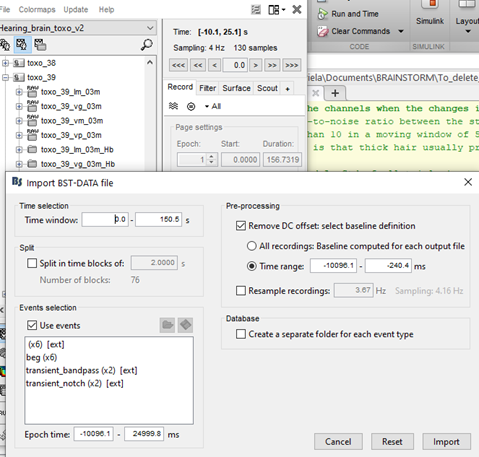
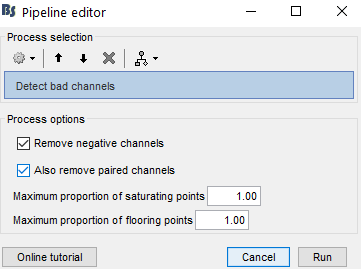
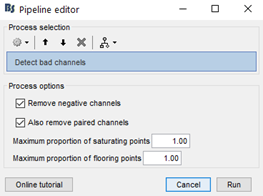
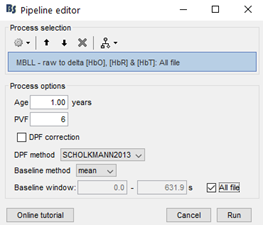
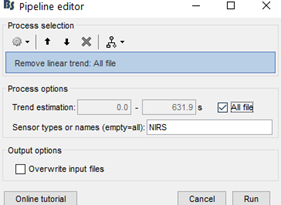
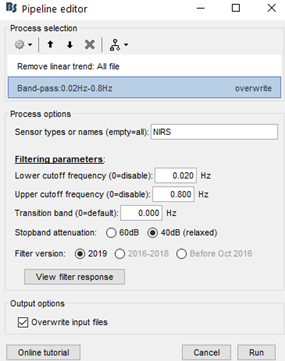
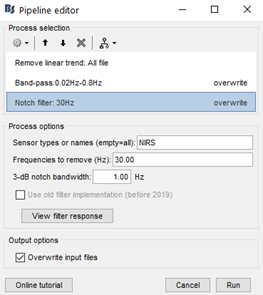
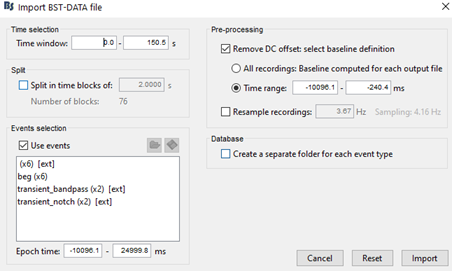
My team and I made fNIS in 61 babies, in four auditory stimuli. All data are already in NIRSTORM. We processed every subjects/conditions with motion correction (manually selected) - detect bad channels - remove glitches - remove linear trend - band pass filter - notch filter - mark flat channels as bad - code in Matlab to detect bad channels due to S/N ratio - visual analyses to detect bad channels and bad trials - standardize the good trials (baseline normalization) and arithmetic average of the trials.

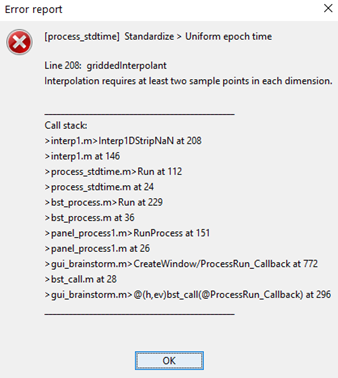
Now I need to make the stats to compare groups (typical and atypical babies) in each condition. I'm trying to run permutation test but I got this error message:

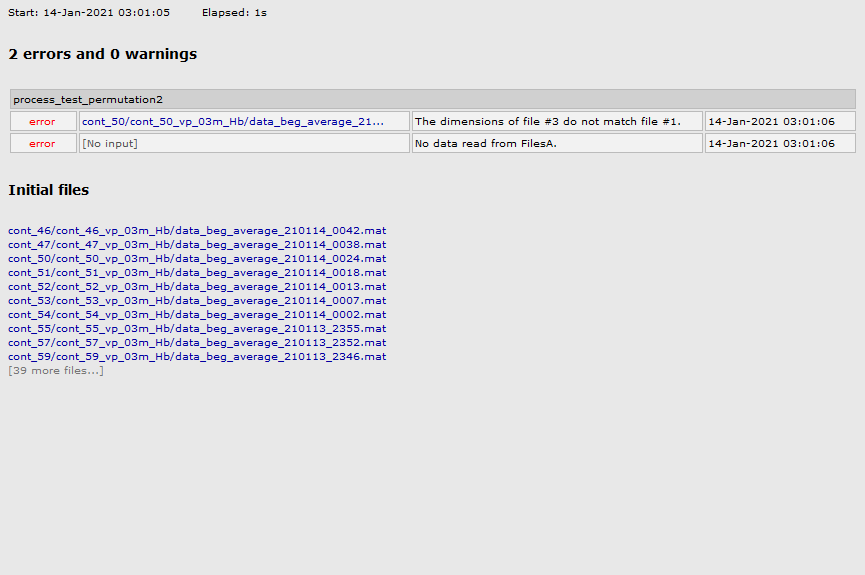
Indeed, I had some "NIRS-BRS sensors" files with 252 and others with 258 (I dont know why, since the geometry file is the same one). I manage to fix it and now I have all files with 252 sensors, but I still get the same error message to run stats.

I already tried “Standardize -> Uniform list of channels”, but “All the input files have identical channel names”. I also tried to delete the files indicated in the error message, or even delete some subjects randomly, but it did not work.

Do you know what should I do to move forward?

Any help would be greatly appreciated!

Kind regards,

Gabriela

First, make sure that all the files have exactly:

  • the same dimensions for the F matrix (check in with right-click > File > View file contents).
  • the same time definition, other the explicit time selection would not select the same time samples (use "Uniform epoch time" in case of doubts or errors)
  • the same list of channel names (but this you already checked)

It may also depend on the options selected in the process, the bad channels, etc.
=> Uncheck the option: Exclude the zero values from the computation

If you still you don't understand why you get this error, put a breakpoint in process_extract_values.m at line 685 and run the computation. When the debugger stops, execute line by line to understand why the file dimensions are not considered as matching.

Hi,

Thank you for your response.

Indeed, I have different dimensions of the F matrix. There are some files with F: [252x147 double] and others with F: [252x130 double]. Is there a way to change to the same dimension?

I also tried to "uniform epoch time" but I got this error message:

image

We chose to study Epoch Time -10 s to +25 s. When we "import in database", BST automatically makes some adjustment in these values like the image below. After "import in database with the same configuration", I have some files with Time: [-10.1, 25.1] s and others with Time: [-10.1, 25.0] s.

image

I think I don't have the option "Exclude the zero values from the computation" in my pre-process paradigm. Should it be because I used the BST version from 19-May-2020?

image

Sorry for the basic questions. This is my first fNIRS analysis.

Many thanks!

Gabriela

You need to re-import the data.
Or use the time window option in the statistics process in order to select a time window that all your files have.

I also tried to "uniform epoch time" but I got this error message:

This process is only to set the same exact time values to matrices that have the same dimensions.
(eg. epochs of the same duration that where extracted in different ways from the continuous files).

We chose to study Epoch Time -10 s to +25 s. When we "import in database", BST automatically makes some adjustment in these values like the image below. After "import in database with the same configuration", I have some files with Time: [-10.1, 25.1] s and others with Time: [-10.1, 25.0] s.

You need to figure this out in order to import files with exactly the same number of samples.
If the files had initially the same time definition, the epochs would have the same number of samples. So there are initial discrepancies in your continuous files that you need to compensate here.
You could also try importing your data with the process "Import > Import recordings > Import MEG/EEG: Events".

I didn't write these functions thinking about such low sampling frequencies, so maybe there are some rounding effects that are not appropriate. Please let me know if you think there is something that should be fixed in the interactive import option window.

I think I don't have the option "Exclude the zero values from the computation" in my pre-process paradigm.

This is an option of the final statistics process.

Should it be because I used the BST version from 19-May-2020?

You should update Brainstorm, even if this is not directly the cause of these problems.

Hello,

I think I am making progress, but something is still getting wrong.

I am avoiding to reimport all over again (from the .nirs file), since I have more than 200 files imported and pre-processed. But, of course, I will do it if necessary.

The option: “Or use the time window option in the statistics process in order to select a time window that all your files have” did not work. I choose -9s to 20s (I was working with -10s to 25s) and I got the same error message.

I tried to run permutation test choosing just files of the same size “F: [252x130 double]” and it worked! But, unfortunately, in this condition/groups I have 28 files “F: [252x130 double]” and 21 files “F[252x147 double]”.

I really have not figured out how to change the 130 files for 147 nor the opposite. My files do not have exactly the same epoch time neither the same time range or even the exactly sampling.

When we import the database, the precise selection of the epoch time has actually been done automatically by BST. I have tried in several ways to standardize the time, but I did not succeeded.

Here are some examples of the automatically generated values when we set the Epoch time from -10000 ms to 25000 ms:

Subject Epoch time Time range
condition Beginning End Beginning Sampling
44_vm -10067.9 25033.7 -10067.9 272.1 3.6751 Hz
45_vm -10073.4 25047.4 -10073.4 272.3 3.6738 Hz
46_vm -10067.8 25033.6 -10067.8 272.1 3.6751 Hz
47_vm -10068.3 25034.8 -10068.3 272.1 3.6749 Hz
48_vm -10082.7 24966.7 -10082.7 240.1 4.1656 Hz
49_vm -10082.8 24966.9 -10082.8 240.1 4.1655 Hz
50_vm -10089.3 24983.0 -10089.3 240.2 4.1628 Hz
51_vm -10087.4 24978.2 -10087.4 240.2 4.1636 Hz
52_vm -10093.2 24992.8 -10093.2 240.3 4.1612 Hz

As you said, maybe there are some rounding effects that have not allowed me to have the same size for all the files. I would appreciate if you could check it for me, please.

I had some trouble to update BTS, but I found this topic https://github.com/brainstorm-tools/brainstorm3/issues/308#issuecomment-646026943 that helped me to solve it. Now I have 21-jan-2021 version!

Thank you!

Gabriela

This is difficult to help you further without having the data in hand...
Can you please share two of your files that lead to different import times and different number of samples?
And describe precisely how you get to the files that have different sizes (maybe a screen capture of the import window options)
(upload the files somewhere and post the download links here)
Thanks

@edelaire @tvincent
Do you have any idea about what the problem could be?

Follow the steps we did to pre-process the files:

Import .nirs file;

Import .evt file (Events – Import from .evt table file);

Check and fix the triggers according to our personal notes (diary) and create an event with just the initial time of the trials (we called it “beg”);

Add a “motor” event and manually select periods with bad record time;

Run “motion-correction”;

Using the “motion-corrected” file:

Run – NIRS – Detect bad channels
image

Run – NIRS – Remove Glitches (Variation threshold 2.00)

Run – NIRS – MBLL – raw to delta [HbO], [HbR] & [HbT]
image

Using the “Hb [topo] file:

Run – Pre-process – Remove linear trend
image

Run – Pre-process – Band-pass filter
image

Run – Pre-process – Notch filter
image

Using the “Hb [Topo] / detrend / band (0.02 – 0,8) / notch (30Hz)” file:

Good/bad channels – Mark flat channels as bad;

Use homemade codes in Matlab to find channels with bad SNR – Good/bad channels – Edit good/bad channels – select the channels identified by Matlab codes;

Select bad channels manually;

Import in database. We wrote -10.000ms - 25.000ms in Epoch Time, but BST made some rounding effects.
image|478x287

Another example of import database using the same configuration:
image

Check trial files to detect bad trials;

Run – Standardize – Baseline normalization (all file; Z-score transformation)

Using the “beg / zcored (x files)” file:

Run – Average – Average files (group files: everything; Function: Arithmetic average + Standard deviation.

Then, I tried to Run permutation test with all “AvgStd: beg / zscore (x)” files but it did not work, as I mentioned before.

You can find some files in this link: Dropbox - BST_GCJ_hearing_brain - Simplify your life

Thank you a lot!

Thank you for the example files.
I confirm that the source of your problems in your .nirs recordings: they indicate different sampling rates...

toxo_18/toxo_18_vp_03m.nirs
    std(diff(nirs.t)) = 1.1161e-14    => Sampling rate is stable within file
    mean(diff(nirs.t)) = 0.2403       => 4.1615 Hz  => 35 seconds = 146 samples
cont_47/cont_47_vp_03m.nirs
    std(diff(nirs.t)) = 3.1650e-14    => Sampling rate is stable within file
    mean(diff(nirs.t)) = 0.2721       => 3.6751 Hz  => 35 seconds = 129 samples

The variations of sampling rate within one file are very low and can't alter the processing.
However, the variations of sampling rate between two files are very large and can explain the differences in number of samples for similar time windows.
This also explains the differences you observe in the import window options: all the times are rounded to the nearest sample. One sample being different between files, the rounding is different.

You need to check with NIRS experts or with the provider of your acquisition system why you get these differences.

  • If this is an error: you may need to fix the .nirs structures (these are simple .mat files you can edit from Matlab).
  • If this is not an error: you may need to reinterpolate all the recordings to the same sampling rate first (you can try doing that with Brainstorm, process Resample)

I added a minor change to the interface so that you can see directly what is the effective sampling frequency in your recordings:
GUI: Time panel: Show decimals for lower sampling frequencies · brainstorm-tools/brainstorm3@e1b3295 · GitHub

image image

(I change the thread title, since this is definitely not an issue related with statistical analysis, but with the first stages of preprocessing...)

Hi.

What device have you used to acquire the nirs data? I am actually surprised to see that the sampling rate is not constant across the subject.

Best regards,
Edouard

Ok! I got it! I tried resample process with some files and I think it worked! I will now try with all subjects. I will let you know!
Thank you a lot for your responses. They are helping me understand my data and the process.

That is great! Thank you!

Hi Edouard!

We performed all measurements with NIRScout Tandem 1616, NIRx Medical Technologies, Glen Head. We built our optical probe with 30 sources (each source contains 2 LEDs centered at 760 and 850 nm) and 28 detectors, allowing 84 source-detector separations that ranged from 1.5 to 2.5 cm.

Best,

Gabriela