Hi
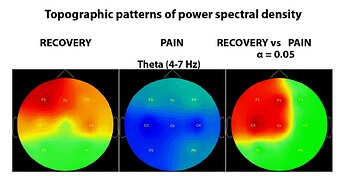
I used non-parametric stats implemented in Brainstorm for statistical analyses on PSD topoplots:
Reviewers are asking me to describe stats in details. Can you let me know a paper that used Brainstorm non-parametric stats and described it in details.
Thanks
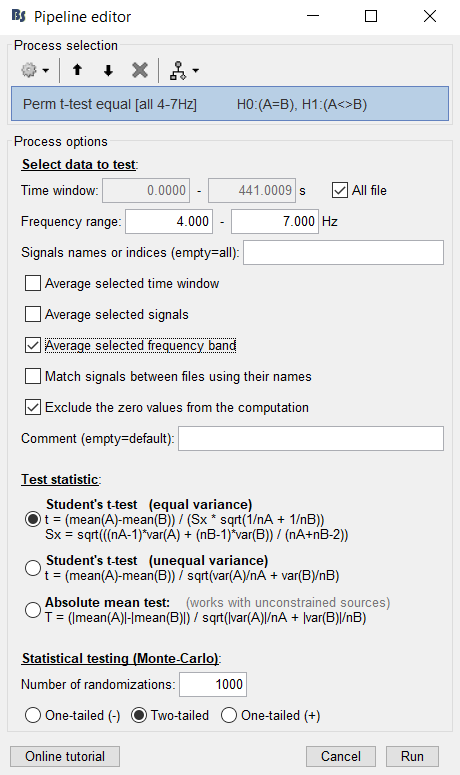
Please post a screen capture of the process options you used to compute these files, to make sure the references are appropriate.
You have a reference section at the end of the page:
https://neuroimage.usc.edu/brainstorm/Tutorials/Statistics#Additional_documentation
This article probably describes something very similar to the permutation tests in Brainstorm:
Pantazis D, Nichols TE, Baillet S, Leahy RM. A comparison of random field theory and permutation methods for the statistical analysis of MEG data, Neuroimage (2005), 25(2):383-94.
@pantazis?
A good reference that describes non-parametric statistical procedures in MEG/EEG is "Maris E, Oostendveld R, Nonparametric statistical testing of EEG- and MEG-data, J Neurosci Methods (2007), 164(1):177-90."
There are many non-parametric statistical procedures so you need to provide more details about your analysis pipeline.
Best,
Dimitrios
Thanks Franois and Pantazis
Pantazis,
Maris E, Oostendveld R, Nonparametric statistical testing of EEG- and MEG-data, J Neurosci Methods (2007), 164(1):177-90
should be about cluster-based permutation test, but what I used is bellow:
I run this analysis:
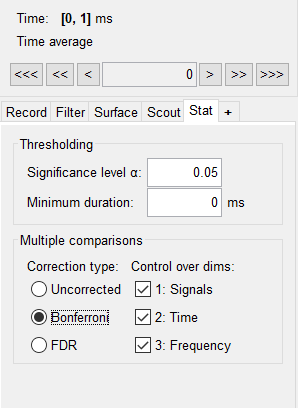
Then applied Bonferroni:

-
What was little confusing to me, we usually talk about t-test and permutation test. What we have in Brainstorm is permutation based t-test and this term is not widely used in a literature. Can we call it Monte Carlo as well or it is mixture of Monte Carlo and t-test as shown in the figure above?
-
When running permutation t-test on PSD topoplots (plot above), does it permute only between the same electrodes (e.g. F3 condition 1 vs F3 condition 2, across N number of people)
Or
It permutes across all the electrodes and subjects?
- Is it still required to apply Bonferroni or FDR with independent or paired permutation based t-test implemented in Brainstorm? In cluster-based permutation test Bonferroni or FDR should not be required.
Thanks
Hi niko808080,
A permutation test needs i) a test statistic, and ii) a resampling procedure. The test statistic is a t-statistic, because you use a t-test. The resampling procedure is based on Monte Carlo sampling to randomly exchange labels A and B between the two conditions multiple times, every time creating a new permutation sample.
I always advise to run the permutations at a subject level to ensure random effects inference. That is, if you have N subjects, for a paired t-test you will have N measurements for condition A and N measurements for condition B. (You may also have an unpaired case with N1 subjects for condition A and N2 subjects for condition B. Make sure you use the proper t-test for your data, paired or unpaired). When you randomize the labels, you exchange the entire spatiotemporal map as a whole (that is, you do not permute one electrode with another electrode, but as you wrote, you permute F3 condition 1 vs F3 condition 2). Eventually, the permutation samples allow you to convert your spatiotemporal t-statistic maps into p-value maps. Finally, you do need to control for multiple comparisons across the entire p-value map because the map comprises multiple statistics (across sensors and time points). FDR is the most straightforward way. You are right that a cluster-based inference does not need this last step.
You may be able to write a text similar to this in your paper, replace A and B with proper names:
“We used non-parametric statistical inference that does not make assumptions on the distributions of the data (Maris and Oostenveld, 2007; Pantazis et al., 2005). Permutation tests were performed across subjects for random effects inference. Under the null hypothesis of no PSD difference in the sensor data between the two conditions, the labels between conditions A and B for each subject could be randomly permuted and the resulting data were used to compute a permutation t-statistic spatiotemporal sensor map. Repeating this permutation procedure 1000 times, using Monte Carlo random sampling, enabled us to estimate the empirical distribution of the t-statistic at each sensor and time point, and thus convert the original data into a p-value statistical map. Last, to control for multiple comparisons across all sensors and time points, the p-values were adjusted using a false discovery rate procedure.”
Best,
Dimitrios
Thanks a lot Pantazis for the comprehensive explanation and Stats Text.
I have 1 more question. After I run permutation based t-test and found statistically significant effects as shown in my first message (PSD topoplot comparison), should I extract values and run ANOVA to show that some electrodes showed effect but others not? Why I am asking, it seems reviewers are interested in providing detailed statistical results like, F, effect size etc., not just t and p values.
Hi niko808080,
The statistical analysis I listed above (sensor-level permutation test combined with FDR correction) will give you which sensors are significant at the given α significance level (typically 0.05). You can also see their t-statistic values if you want to explicitly report them. There is no point in running an additional ANOVA test on the same sensors that you already found significant. In fact this would be a circular analysis because you would be retesting the same sensors that you already found an effect.
Best,
Dimitrios
Thanks Dimitrios.
Exporting statistics file to Matlab I can find all the t and p values, so I will report them, significant ones.


