Dear François,
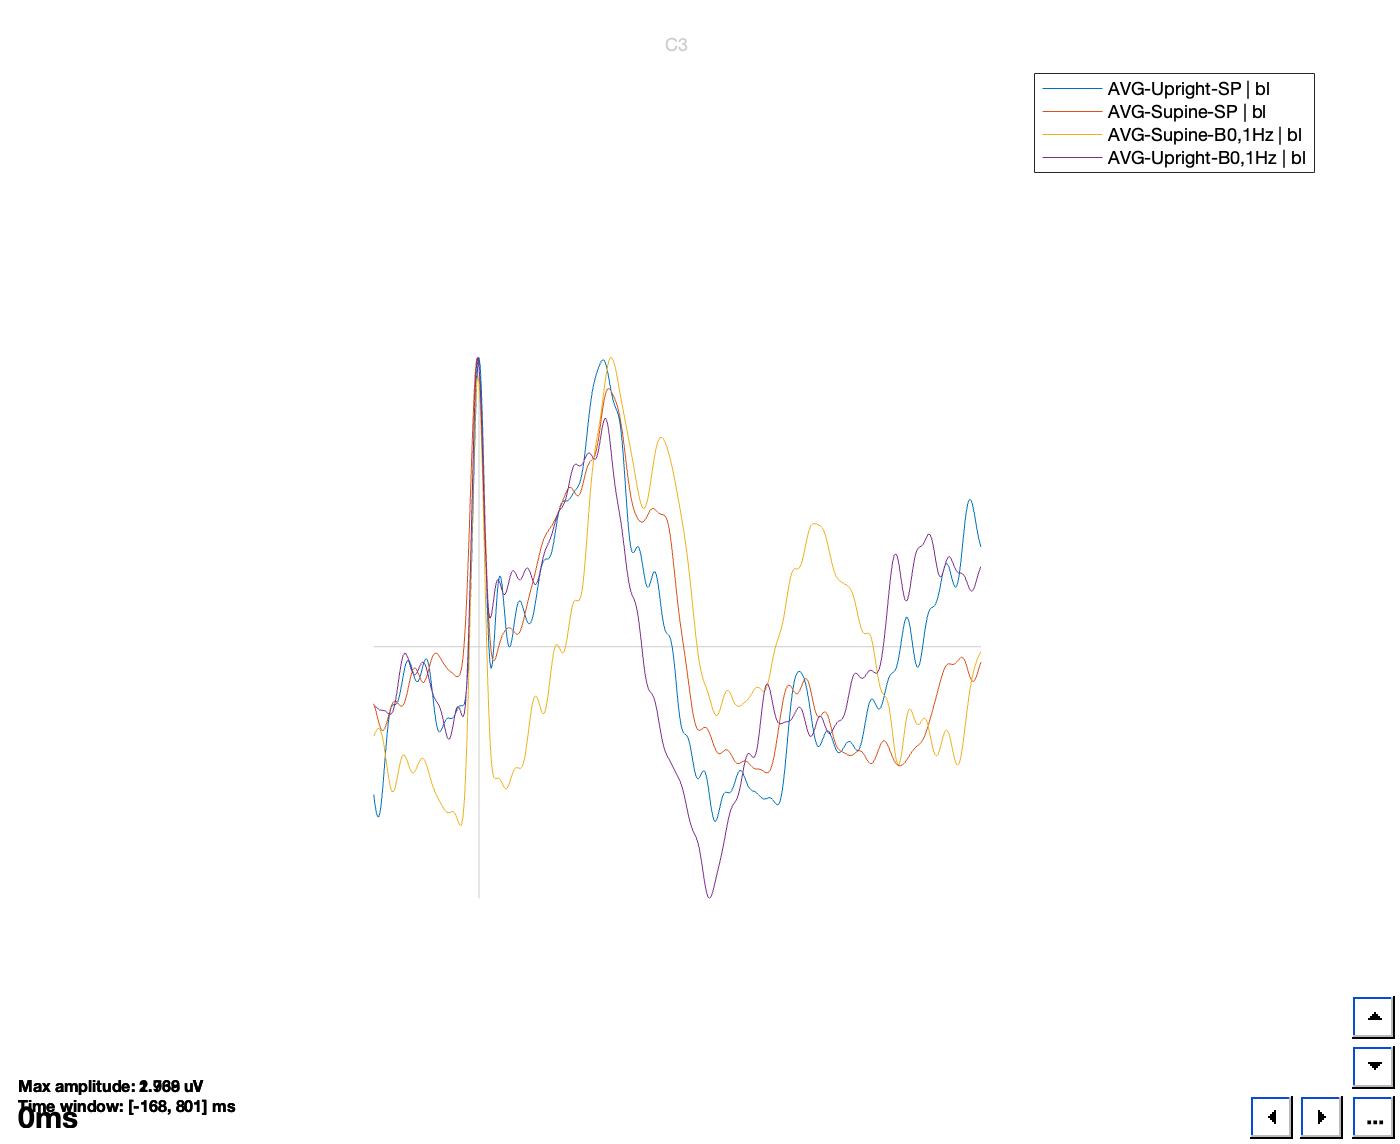
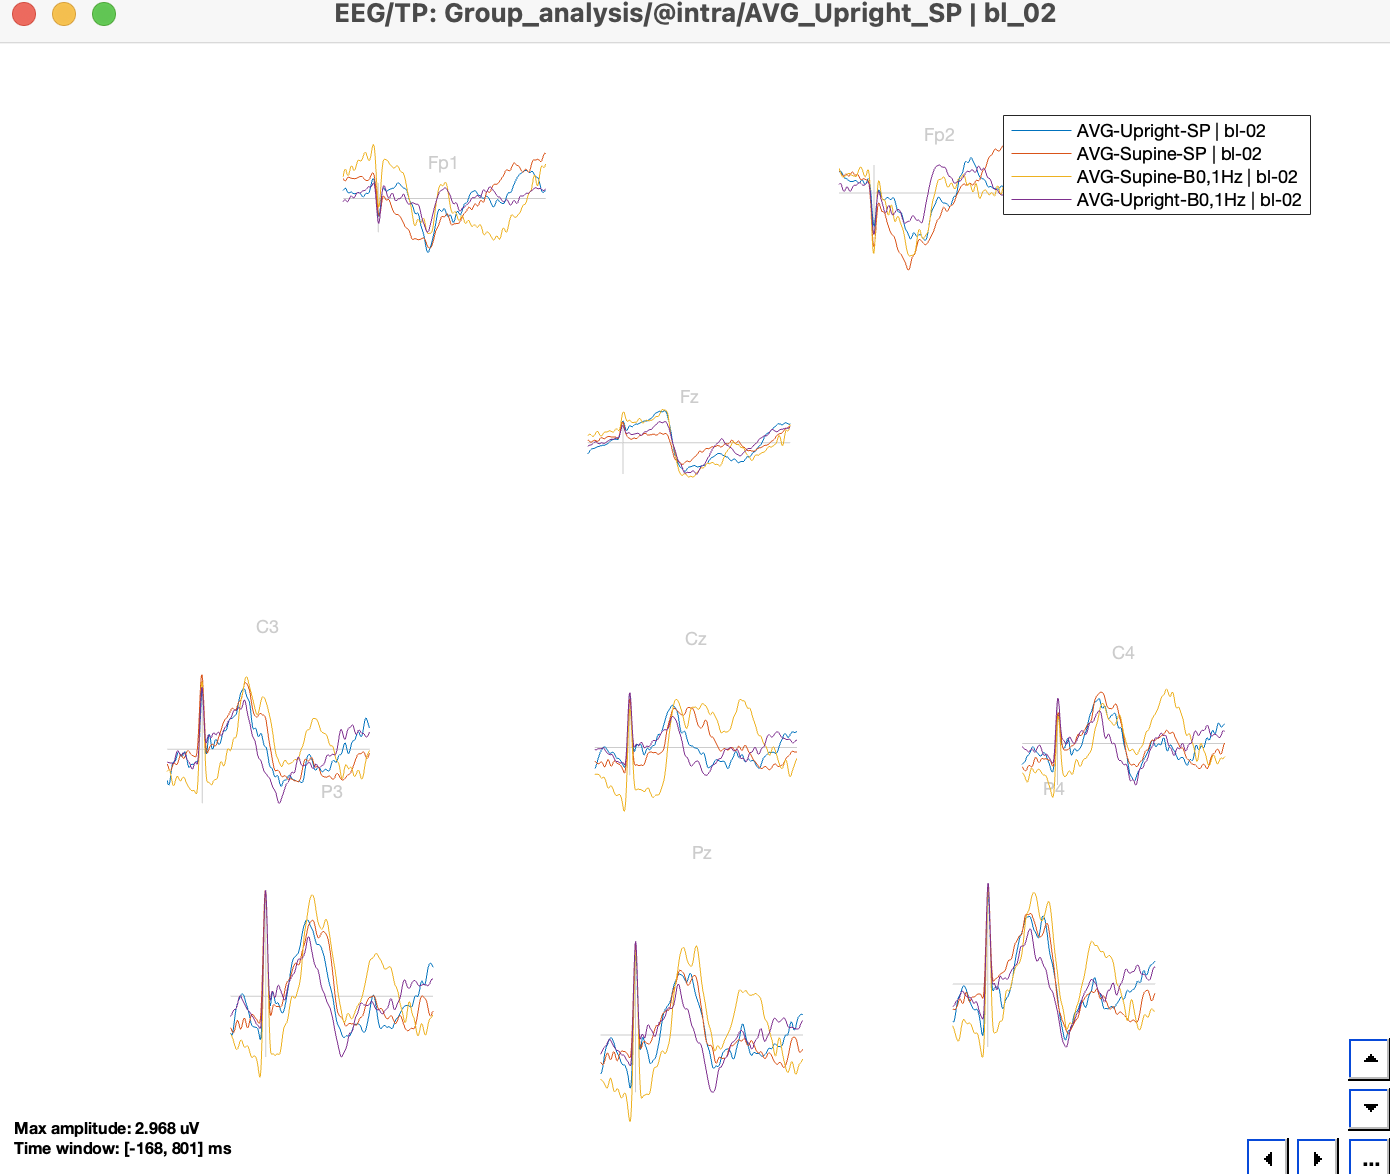
I would like to show on a graph signals varying according to the conditions but being on the same electrodes for each condition (Cz, standing, lying down for example).
I have done a DC offset correction on each signal independently but when I put them on a graph, the normalization is not done anymore (example in the figure).
How to make the signals be normalized in the same way on the graphs?
Thank you, for your time for your answer.
Please describe your full pipeline to obtain this graph, starting from the ERP.
Include screen captures of the various files (as they displayed when double-clicking on them), and a view of all these files in the database explorer.
Thanks
@ArthurP
Please post your messages on this thread (click on the Reply button below).
Explain what you do, step by step. For each step, include a short description and screen captures.
Thanks.
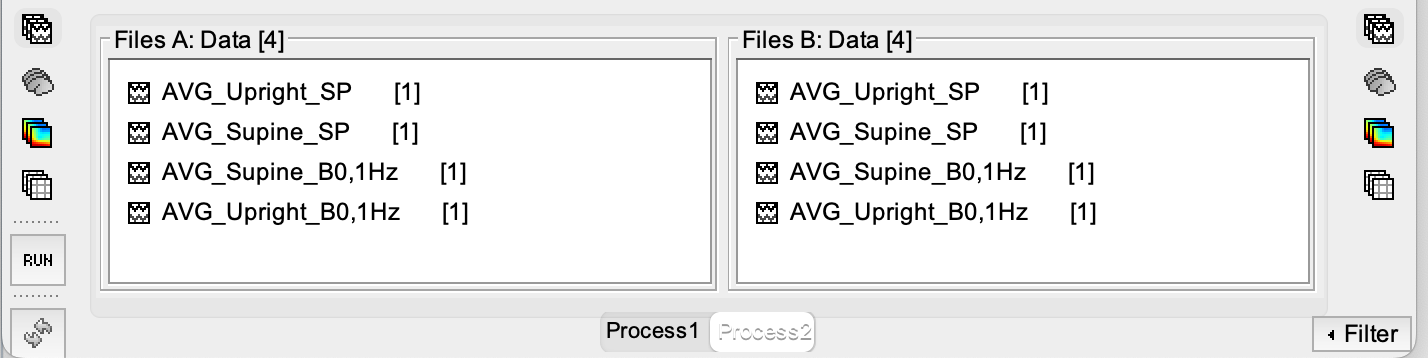
Pour faire mettre la baseline de différents signaux sur un graphique, pour une meilleure lecture des signaux, il faut aller dans Process 2, puis mettre les signaux dans les différentes importation de data, A et B.
To put the baseline of different signals on a graph, for a better reading of the signals, it is necessary to go to Process 2, then put the signals in the different data imports, A and B.
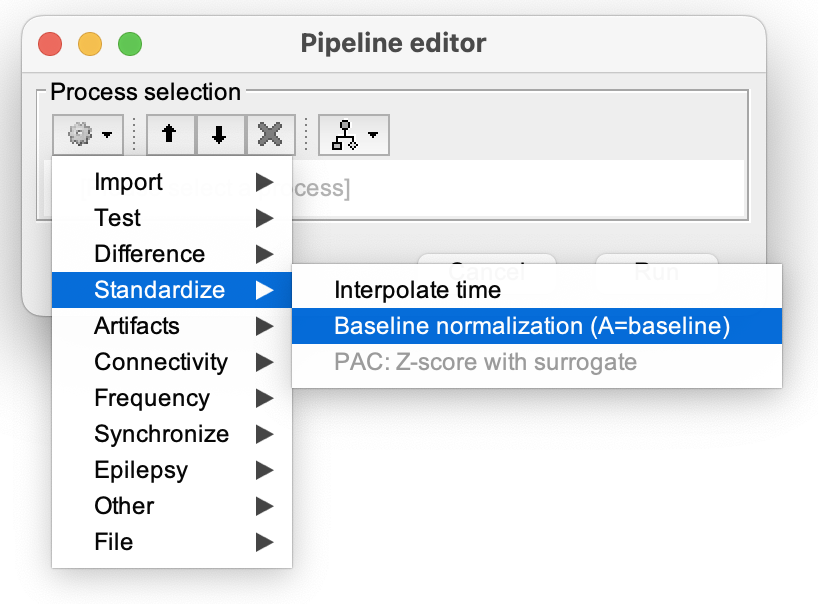
Once this is done, you have to go to the standardization and make a standardization of the B files on the A files taking into account all the signals.
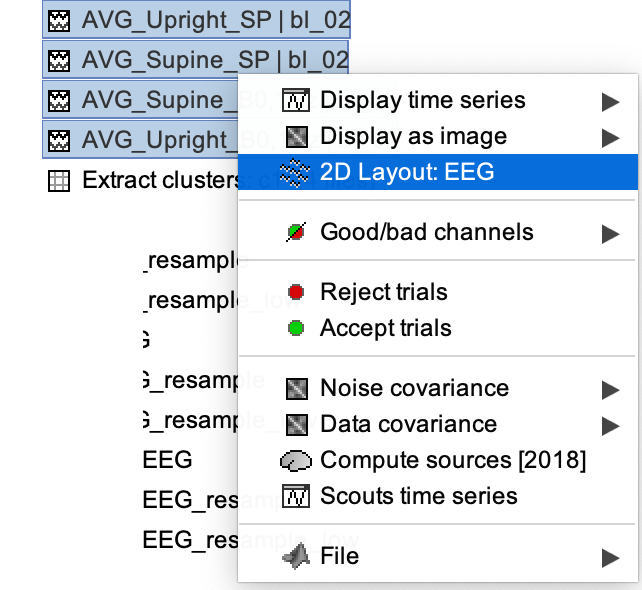
To visualize the results, click on 2D Layout: EEG.
Here are the screenshots to illustrate:
Arthur,
Oh, so you already figured it all out 
Sorry for the account issue.
1 Like
I don't know if this is the most efficient but it solved my question!
No worries, thanks for your time!
Arthur,