Brainstorm
NxN spectral granger producing odd results
Bugs
granger
,
connectivity
moon94
September 13, 2019, 6:31pm
5
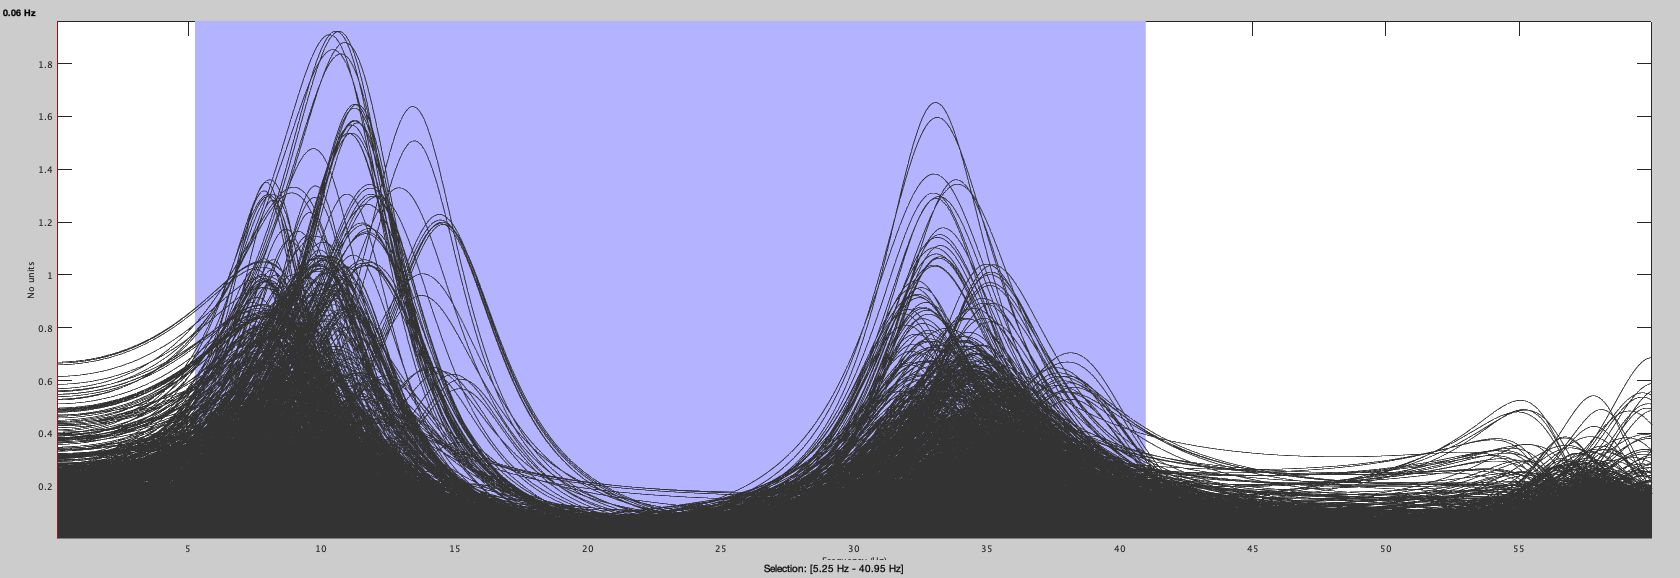
Here is the difference in power spectrums
1hz
1680×578 67.5 KB
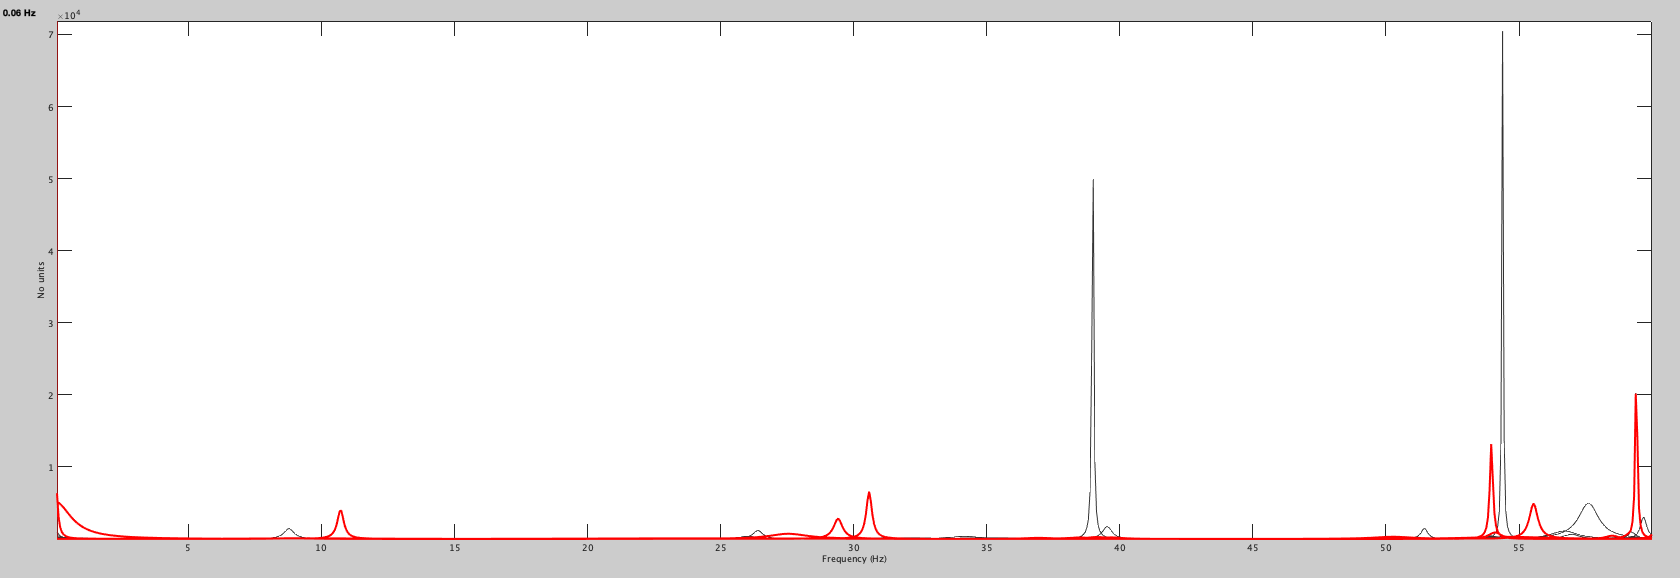
EEG_PSD_Subject04_S05_T01_preprocessed
1680×578 9.23 KB
(what is presumably the erroneous one)
Potential issue with bst_granger_spectral
show post in topic