Hi all
I computed the oAEC (1*N) (for given one time-window and one frequency band) for subject under two conditions, then got a time-frequency map in each condition.
I want to know where the statistically significant difference in oAEC between conditions is.
BST can statistically analysis oAEC data between conditions?
In my image, I want to process oAEC data statistically like source data analysis, and know where the oAEC differs.
Best,
Jun
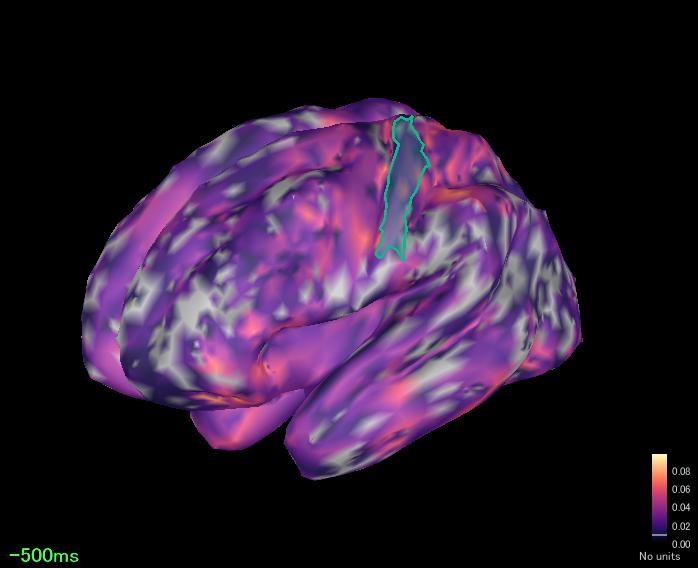
Green ROI is seed region
You should be able to use the non-parametric tests on any data type, including the AEC measures, both on the full cortex or on scouts.
https://neuroimage.usc.edu/brainstorm/Tutorials/Statistics#Nonparametric_permutation_tests
@Sylvain @pantazis Any additional recommendations?
hi Francois
thank you for your quick reply.
It's a simple question. when I use non-parametric test, I am asked to set the time window and frequency range.
Is the default parameter all right?
Jun
The process offers by default use the entire dataset (all the time points, all the frequencies). Unless you want to change this, keep the default values.
Note that if you are planning to use a FDR correction for multiple comparisons, the number of data points you consider changes the results.