Dear all,
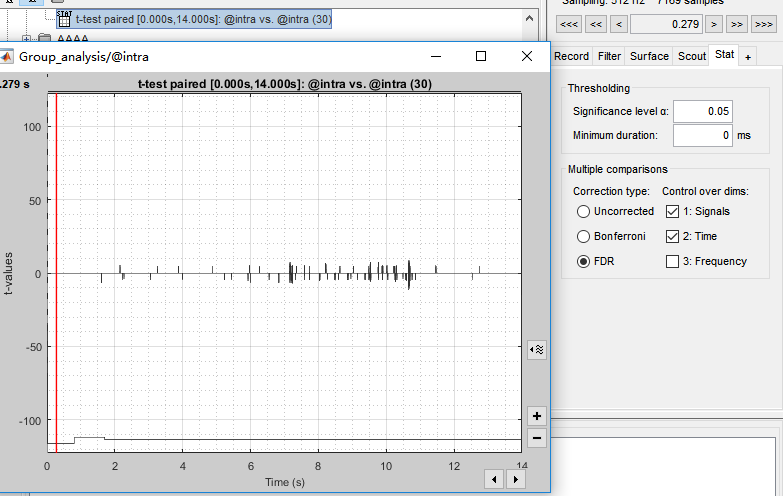
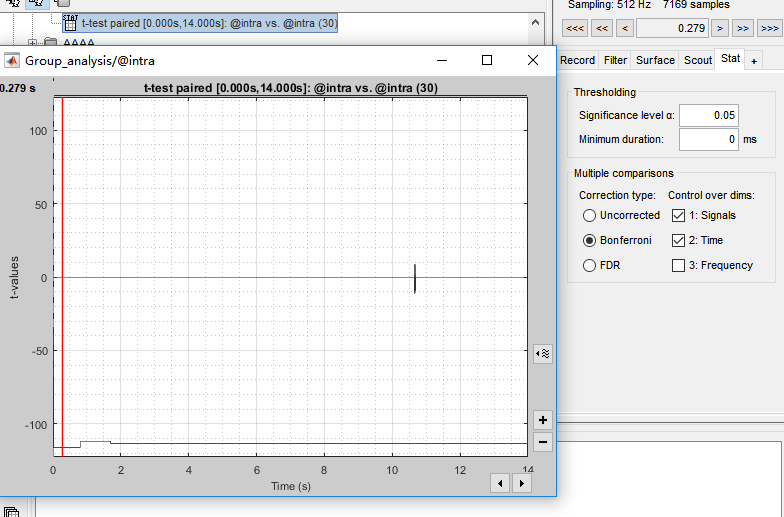
I compared the ERF between condition A and B by using parametric test paired. The results are displayed as the following picture. Clearly, the correction type matters a lot. To identify when and where did these differences lie in, I exported the results to matlab. However, whatever the correction type I chose, p values in the matrix of pmap stayed the same. So, I am pullzed about the exact meaning of pmap. Are the p values in the matrix of pmap uncorrected, or are they corrected by FDR/Bonferroni?
Moreover, as there were many data points significant only for isolated time samples, I want to know how to deal with them if I want to avoid false postitives.
Many, thanks!
Hi!
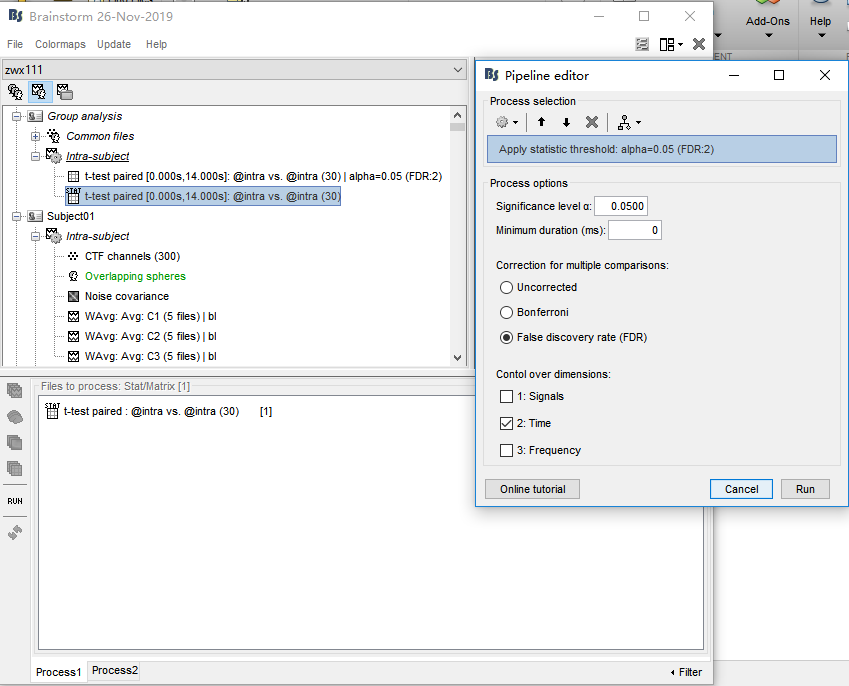
Brainstorm stores the uncorrected p-values in the statistics matrix objects, and applies the selected multiple comparisons correction on the fly. If you want the corrected p-values, you can run the Test -> Apply statistic threshold process on your statistic object to get a new matrix object with the corrected values.
I hope this helps,
Martin
I have this doubt too, I applied the statistic thr and then I exported the file to excel spreadsheet, but the contents is:
| Freq |
alpha |
beta |
| Fp1 |
-5 |
0 |
| Fp2 |
-13 |
0 |
| F3 |
7 |
7 |
| F4 |
17 |
25 |
| C3 |
15 |
11 |
| C4 |
15 |
7 |
| P3 |
11 |
0 |
| P4 |
9 |
7 |
| O1 |
-7 |
0 |
| O2 |
-13 |
-11 |
| F7 |
-5 |
-5 |
| F8 |
0 |
19 |
| T3 |
9 |
19 |
| T4 |
-11 |
0 |
| T5 |
-9 |
0 |
| T6 |
0 |
-17 |
| FZ |
25 |
13 |
| CZ |
11 |
7 |
| PZ |
7 |
7 |
P values can never be negative, so I don't understand what these values are, I tried to open the previus file (before the statistic threshold) as a matlab variable, but Its has 38 values, I think these values are actually the P values I was looking for, but I don't understand why 38
Thanks ind avance!
Hi Martin,
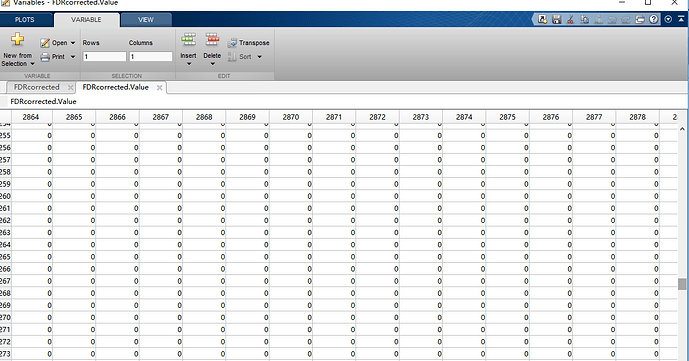
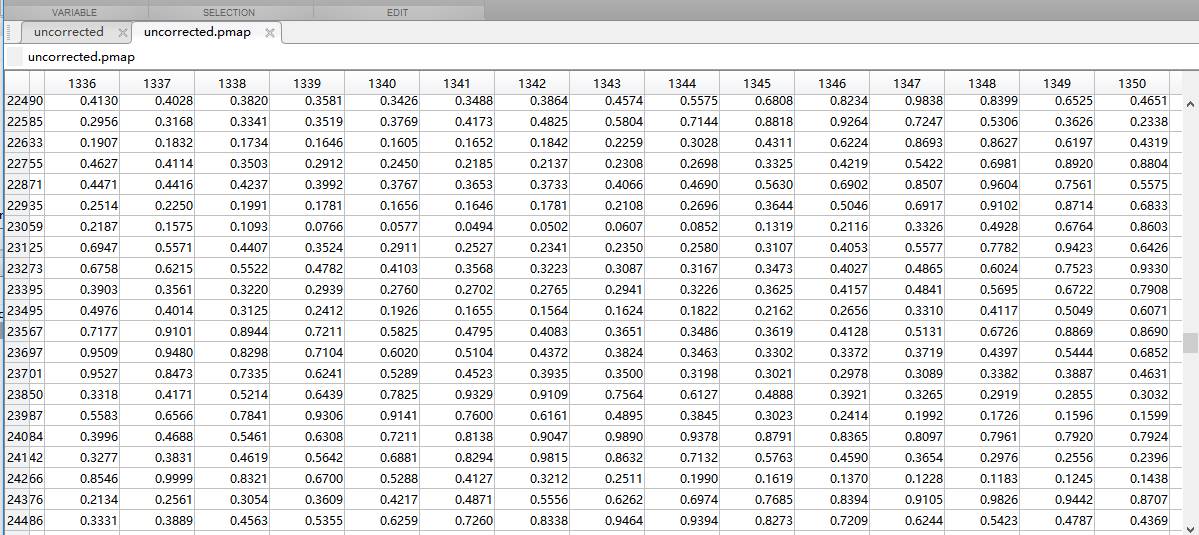
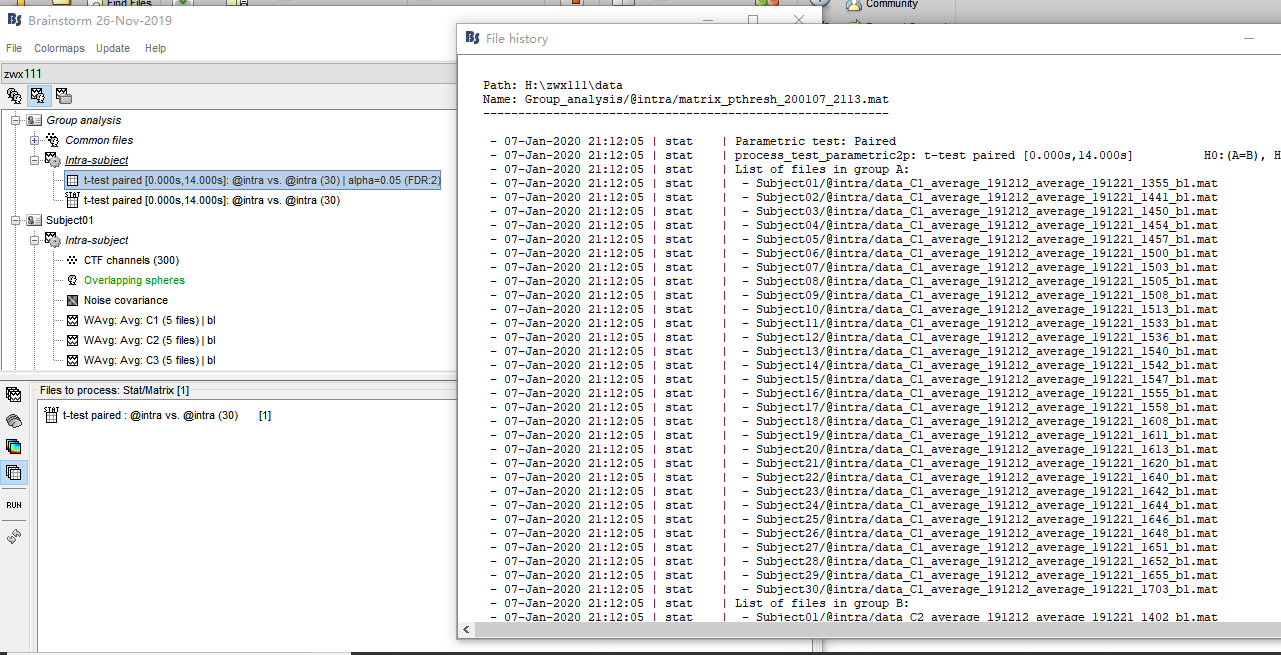
Thanks for your reply. I tried to generate a new matrix as you suggested(by using FDR). Amazingly, I got a matrix filled with zero, see the second picture. The last picture corresponds to the uncorrected matrix.

I want to know what's wrong with my processing? Many thanks.
@zhangweixiamm @MartinC
The values in the pmap matrix never get modified. The correction for multiple comparisons modifies the p-value threshold used to mask the non-significant values. This is done in function bst_stat_thresh.m:
https://github.com/brainstorm-tools/brainstorm3/blob/master/toolbox/math/bst_stat_thresh.m#L76
What you obtain in output of the process "Apply statistic threshold" is the same as what you see in the Brainstorm figures, provided that you use the same options. For parametric tests, it calls the function bst_stat_thresh exactly in the same way:
https://github.com/brainstorm-tools/brainstorm3/blob/master/toolbox/process/functions/process_extract_pthresh.m#L282
@tourette95
This is obviously a different problem, what you show here are not p-values.
Please post your question in a different thread and explain what these values are and how you obtain them.
@zhangweixiamm
The time series you showed are surprising: what is this line a the bottom of the figure?
what are these signals and how did you obtain these files you are testing?
Please include a full view of the database explorer showing the files you tested and the results.
Hi Francois,
Many thanks. This is a musical listening study. The duration of all stimuli is 14s, three conitions in all. In such a case, ERF analysis about the whole segment of music is little of sense. I conduct ERF just to grasp the global trends of neural response. Following are my processing steps for ERF:
Preprocessing(Notch-resample-low pass-high pass-import)-average within block(I got a file in each block per condition)-average across blocks(I got a file under each condition for each participant)-baseline correction(0.7s-0.05s before music onset).
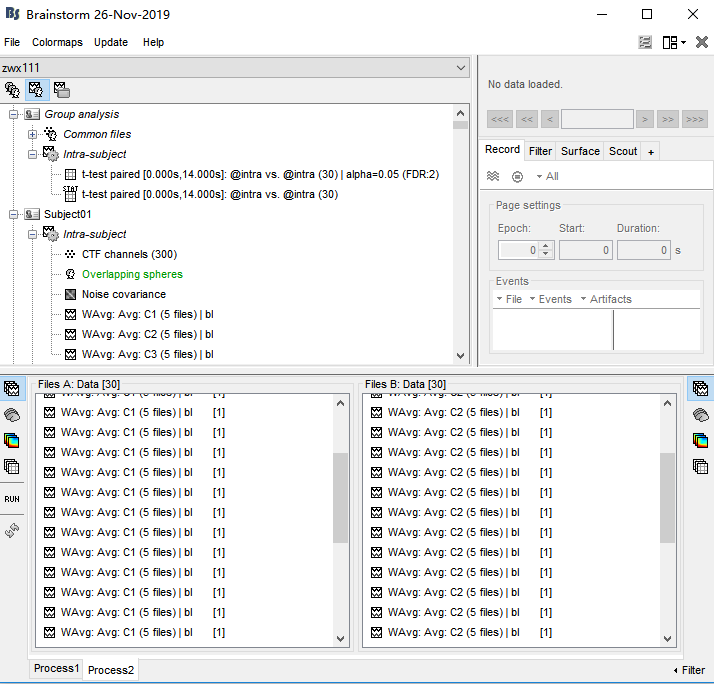
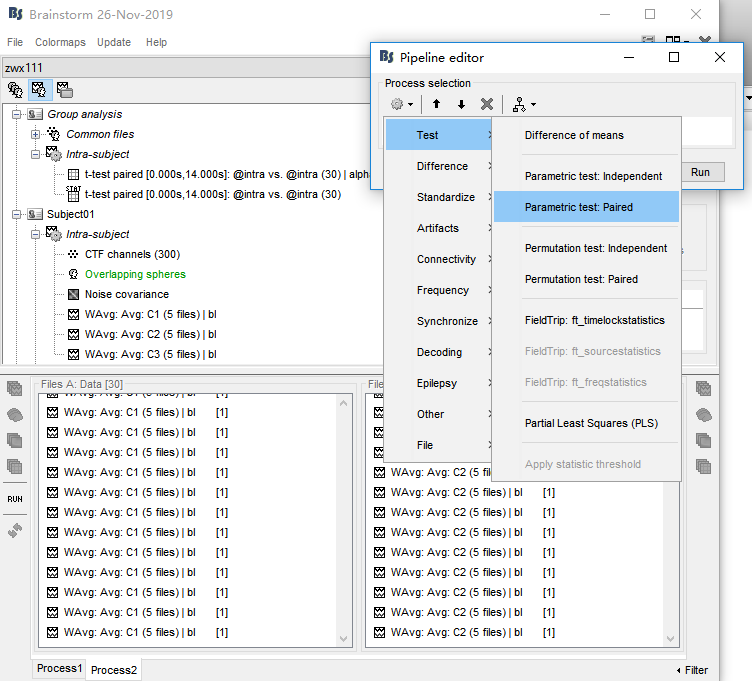
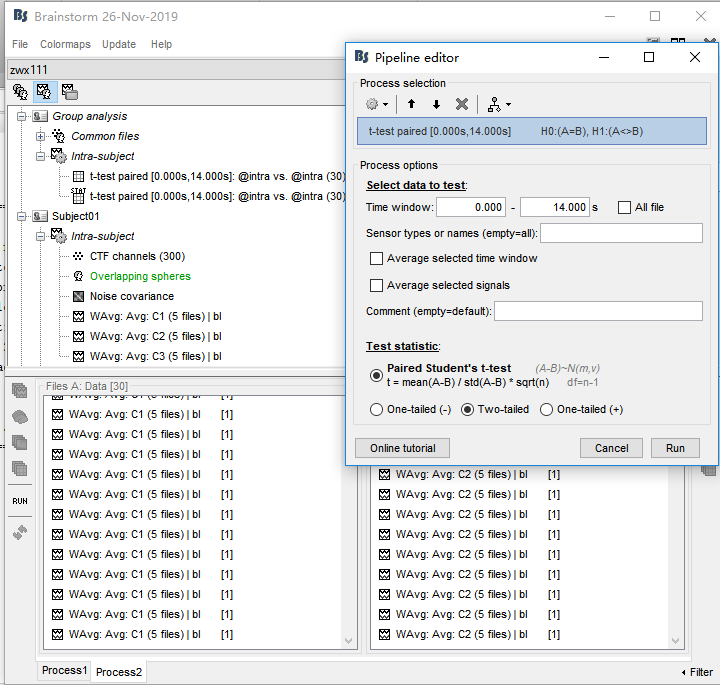
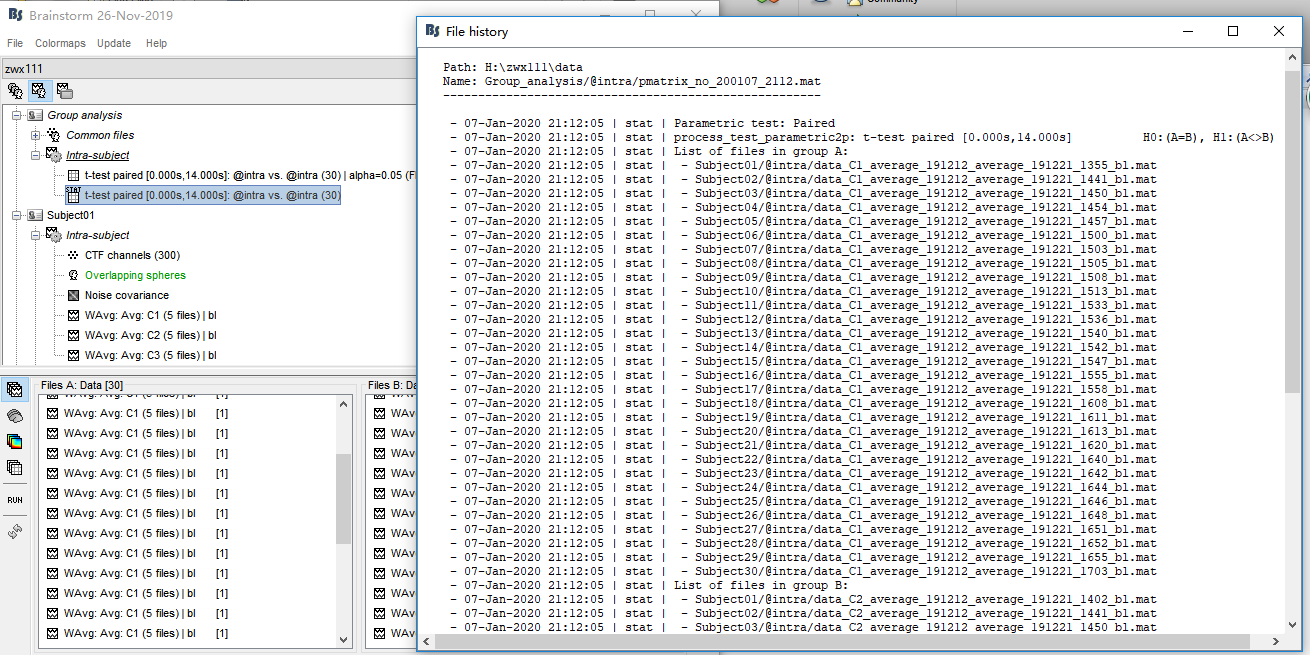
Next, I drag WAverage file in 'intra'(see picture1) and conduct Test(see picture2,3). This produced a file in Group analysis-Intra subject. In this file, I got the uncorrected P map(see picture 4). Finally I drag this file and conduct 'Apply statictis threshold'(see picture5). Another file generated(see picture6)
picture1
picture2
picture3
picture4
picture5
picture6
@tourette95 Please create a new separate thread to post your questions. I will delete your messages from here, since these are unrelated with the initial question in this thread. Thanks
Preprocessing(Notch-resample-low pass-high pass-import)
Maybe all these filters are not necessary for what you are doing. If the low-pass filter is lower than the frequency you notch, then you don't need a notch filter.
baseline correction(0.7s-0.05s before music onset)
I guess what you call baseline correction here is a DC offset removal?
If so, then you should probably apply that when you import your epochs in the database.
But most importantly, this removing the slow trend in the signals is probably already done by the high-pass filter you used on the continuous files.
Only use pre-processing operations that are necessary for your analysis.
Next, I drag WAverage file in 'intra'(see picture1) and conduct Test(see picture2,3). This produced a file in Group analysis-Intra subject
What you describe seems ok, but it doesn't match the results you obtained. You should have the same type of files (and the same icon) for all the files.
It doesn't look like the file we see in "Intra-subject" were created with the options you show in figure 3, because you had files of the time "data" in input, but "matrix" in output. You may have had the option "Average selected signals" selected, or a subset of channels selected. I guess there is something unclear at this stage...
Do you have any specific question about all these screen captures that you posted?
What else do you need help with?
I understand
didn't want to bother,
sorry
Not yet, Francois. Many thanks !
