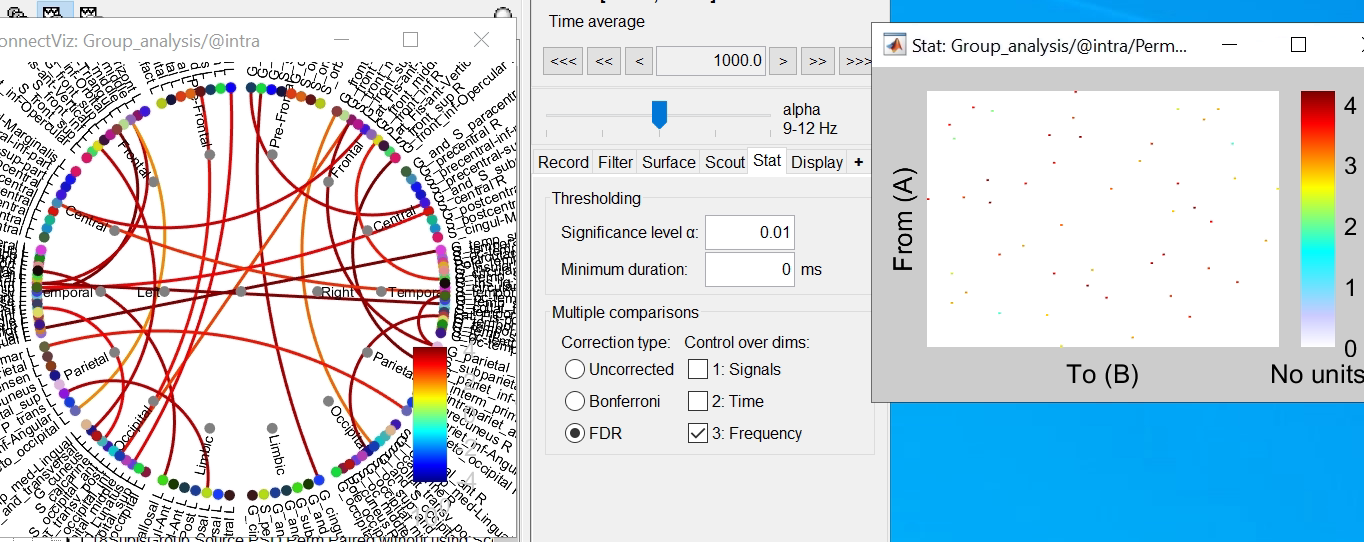
Yes the files selection is just for illustration and I computed average PLV across trials for one subject, and then ran permutation t-test between space and time conditions across 19 subjects.
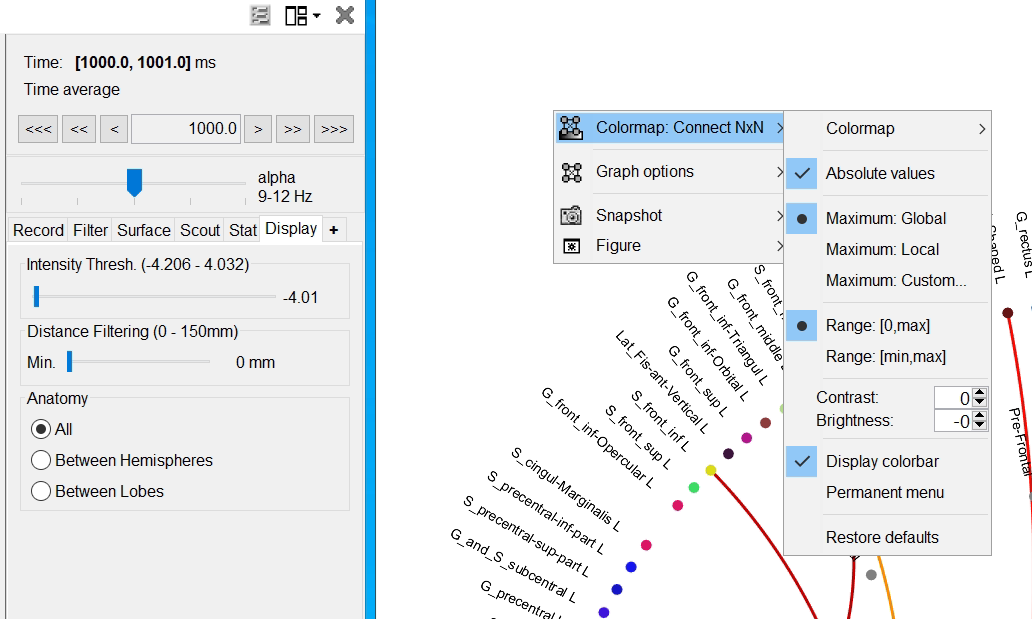
I changed the scale to max. global for graph and adj. plots and the intensity threshold & distance to min. values for graph plot. Below are the results which look representative to each other. Could you check if this is correct?