Hi Francois,
Thank you so much always for your support on this forum.
I attempted to perform a statistical analysis on normalized source-level hilbert transform files.
Each file includes three frequency bands (theta, alpha, and beta at Brainstorm default bands).
Each file has also been averaged over time.
I have 2 within subjects conditions, and 20 subjects for each condition (i.e. 20 files/condition).
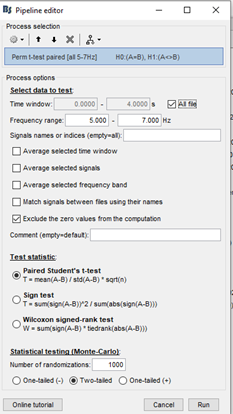
I ran a perm t paired test on the theta band based on the following settings.
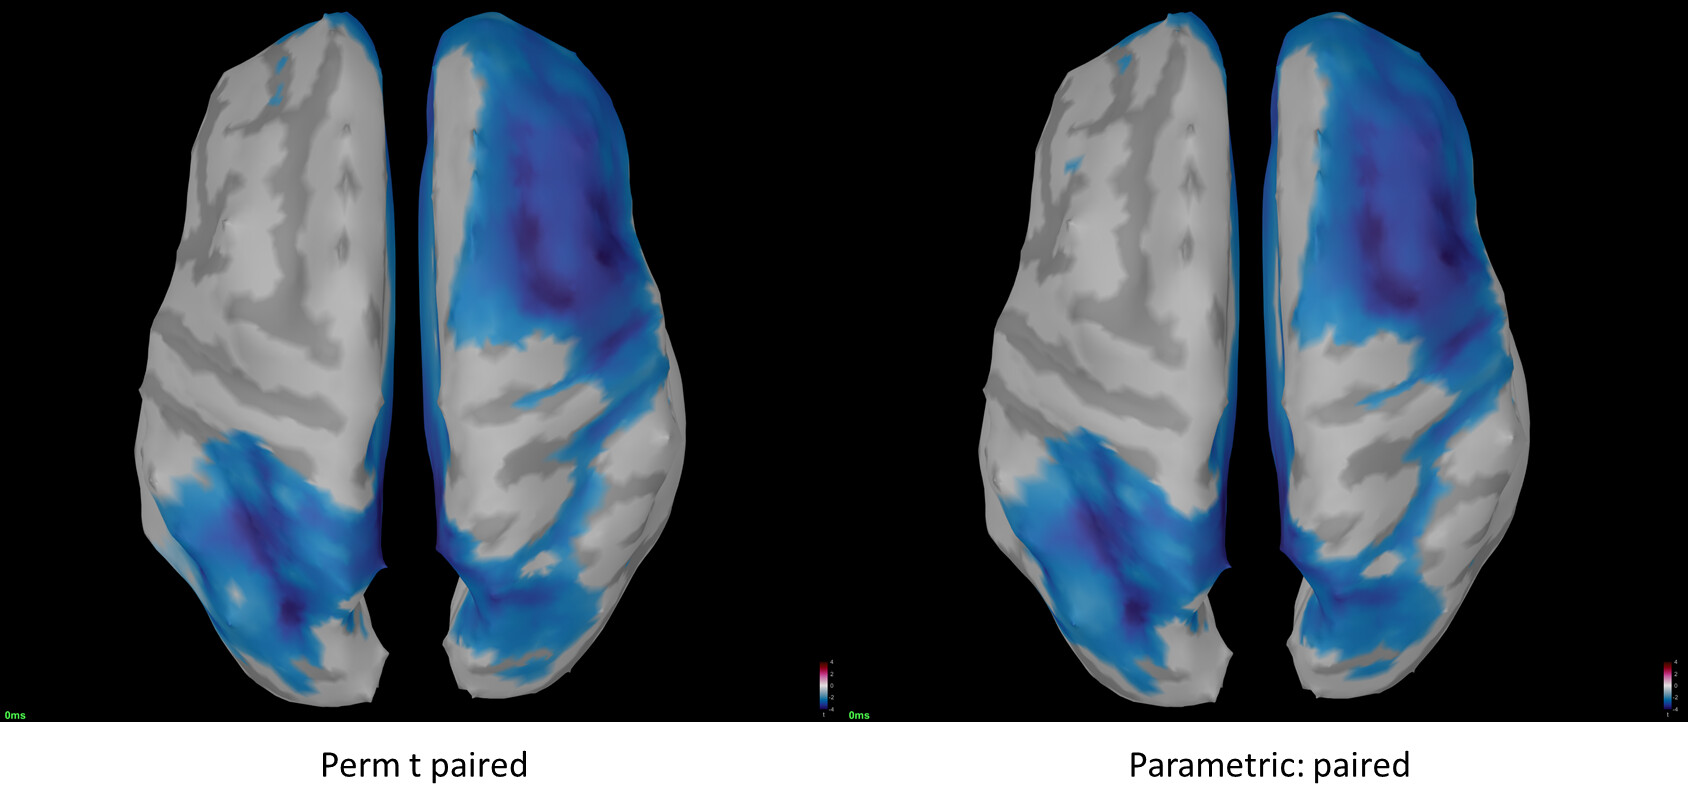
I got the resulting t map.
perm t paired theta.tif (1.9 MB)
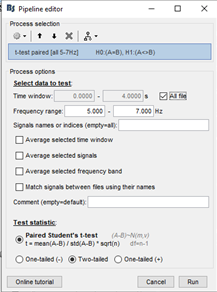
For comparison, I ran a regular paired t test (i.e. parametric: paired) based on the following settings.
Strangely, I got nearly the exact same t map.
paired t theta.tif (1.9 MB)
I would have expected the perm t paired test to be much more stringent and result in a more conservative t map than a regular paired t test.
I am suspicious that one of the two is not right (probably the permutation test) but don't understand why.
Do you have any thoughts on this? I searched the forum to see if someone else had brought this up but couldn't find a thread on it.
Here are the images side by side for easier comparison
Thank you very much in advance for your thoughts and advice.
Best,
Jared
P.S. A frequency selection option in the cluster analysis test for future updates would be fantastic!
1 Like
If the empirical distribution of the values you are testing is not too far from a normal distribution, the parametric and non-parametric tests are expected to give almost the same results.
See the screen captures in the permutation example in the statistics tutorial, the results are almost identical:
https://neuroimage.usc.edu/brainstorm/Tutorials/Statistics#Example_2:_Permutation_t-test
To test for the normality of the distribution:
You can extract all the values for both sets of files for one test (one source x one time sample x one frequency) with the process Extract > Extract values, and then plot the histogram of values, as illustrated in the tutorials:
https://neuroimage.usc.edu/brainstorm/Tutorials/Statistics#Histograms
@pantazis Am I missing something here?
Francois,
As always. Thank you so much for your prompt replies on this forum. You are awesome.
I had read that comment about parametric and non-parametric in the tutorial.
Nevertheless, I still felt very suspicious. Naturally, I want to be confident in the results before publishing.
I will plot the distributions as suggested, and will try and follow-up here for other users.
Thank you very much again.
Jared
Hi Francois,
You are not missing anything, your answer is exactly right. Parametric and non-parametric tests will converge to the same answer when distributions are Gaussian.
Best,
Dimitrios
Awesome. Thank you Pantazis. You guys really are sensational.
Will update soon with the results of the distribution check.