Hello Brainstorm,
When doing any permutation testing through Brainstorm is there a way the user can view the resulting histogram of the permutations? I couldn't find such information through the tutorial or the forum.
I definitely know that you can plot histograms using Brainstorm but I want to know if I can view the histogram of the randomisations as a consequence of doing the permutation testing.
Many thanks in advance.
Hi Brainstorm,
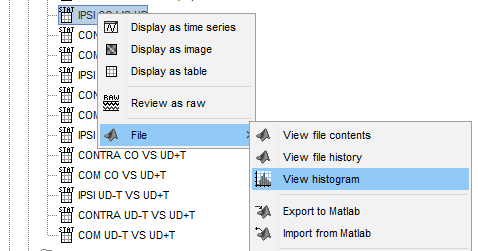
Regarding the above question, is "view histogram" the same as viewing the histogram of the randomised permutations?

By default, the statistic values for each permutations is not saved.
Saving the statistics for each permutation would be significant add to the memory and disk usage. Consider that the memory usage is already high as all the data needs to be in memory, as mentioned here:
https://neuroimage.usc.edu/brainstorm/Tutorials/Statistics#Nonparametric_permutation_tests
For example for the Introduction tutorial, the time series permutations at sensor level would be:
1000 (permutations) × 276(sensors) × 361(time samples) × 4(bytes) = 0.22 GB
This is not that bad.
However, using time-frequency data at the sensor level become
1000 (permutations) × 276(sensors) × 361(time samples) × 30(freq bands) × 4(bytes) = 6.8 GB
This is the extra memory needed, to hold the statistics, and by saving it, it will lead to a very big file.
In the source space, it would not be possible for most users:
1000 (permutations) × 15000(sources) × 361(time samples) × 4(bytes) = 12 GB
From the description above, only the permutation statistics only for analysis of time series in the sensor level are in a size that would be manageable.
@Sylvain, what do you think of adding an option to save the permutation statistics (with default = No) for the specific case of time-series at the sensor level?
No, the option View histogram only display the histogram for the all the "data" in the file. Where "data" depends on the type of file. In the case of the stat file, it is the histogram of all the statistic values (e.g. t-values)
Thank you for the detailed explanation @Raymundo.Cassani.
The option to save the permutation statistic for the specific case of sensor level timeseries would be great.