Hi Francois
Here are some screenshots from the issue.
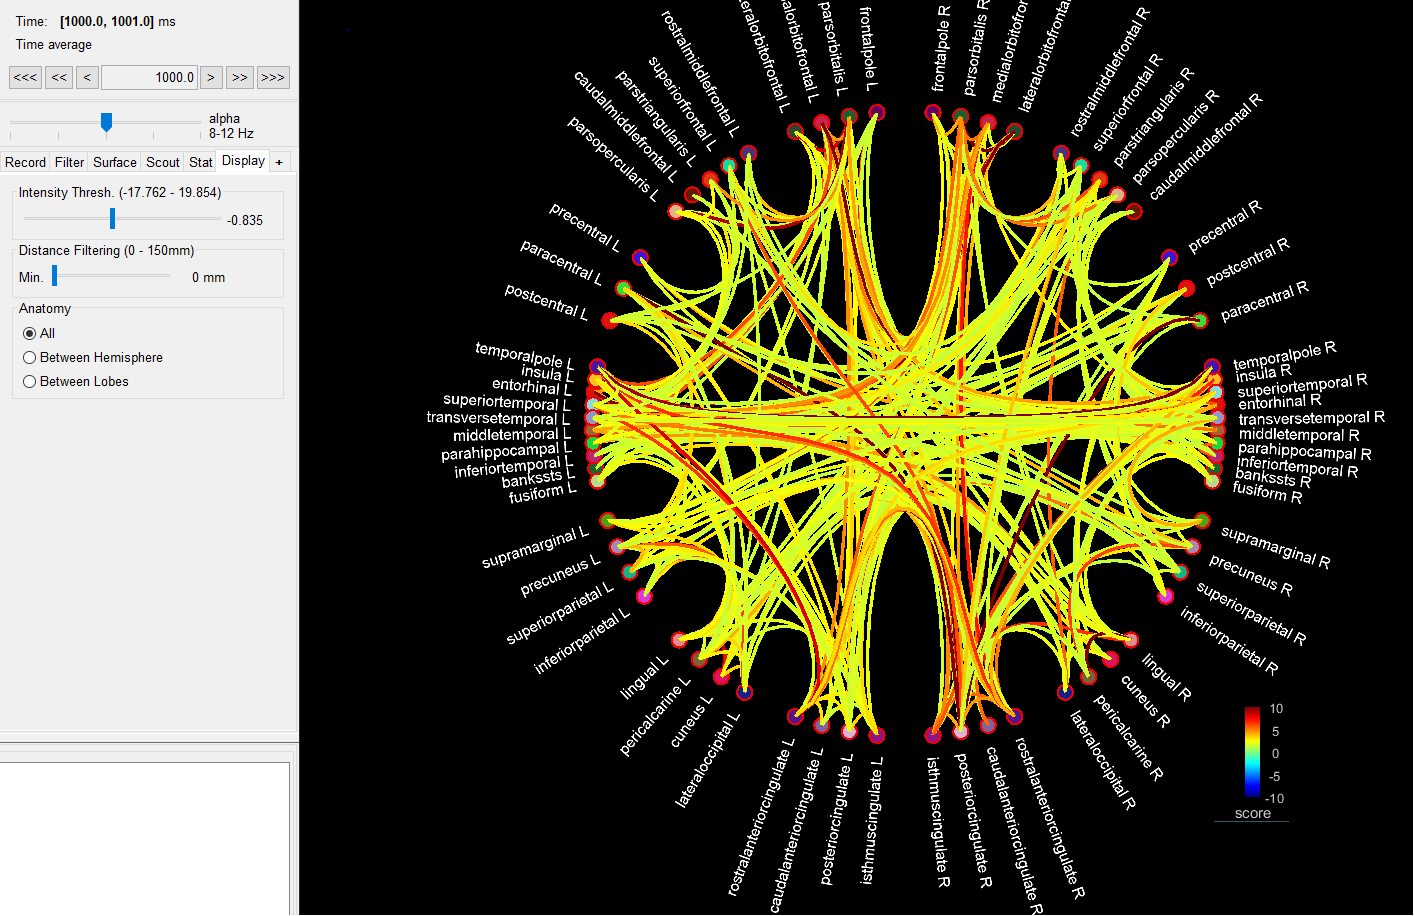
Statistical comparison is with "Uncorrected" and p<0.2, Colourbar is [-10,10].
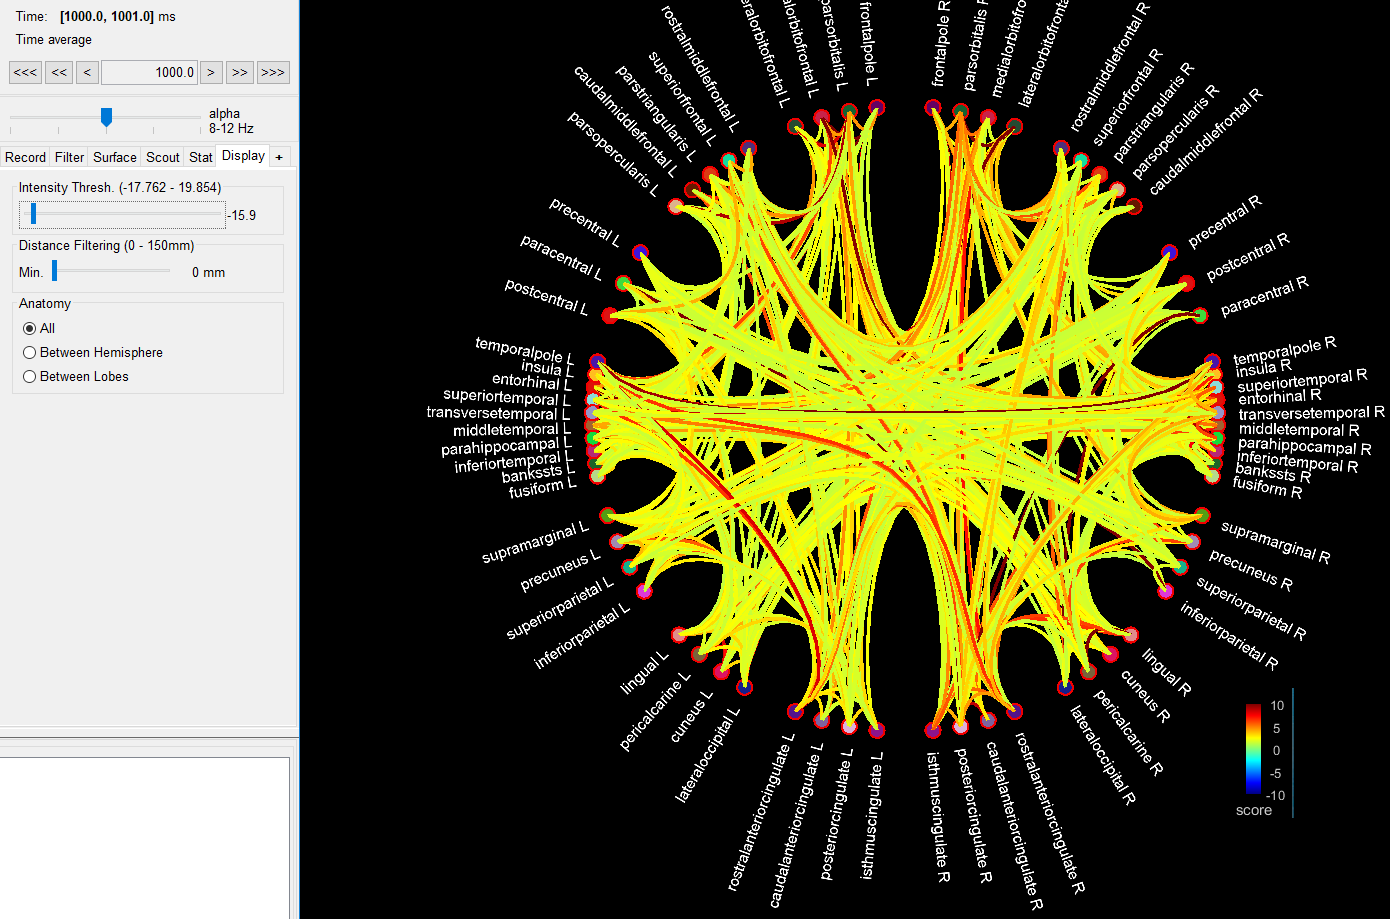
As the Intensity Treshold slider moves from -0.8 (upper picture) to -16 (2nd picture).
Only positive links appear.
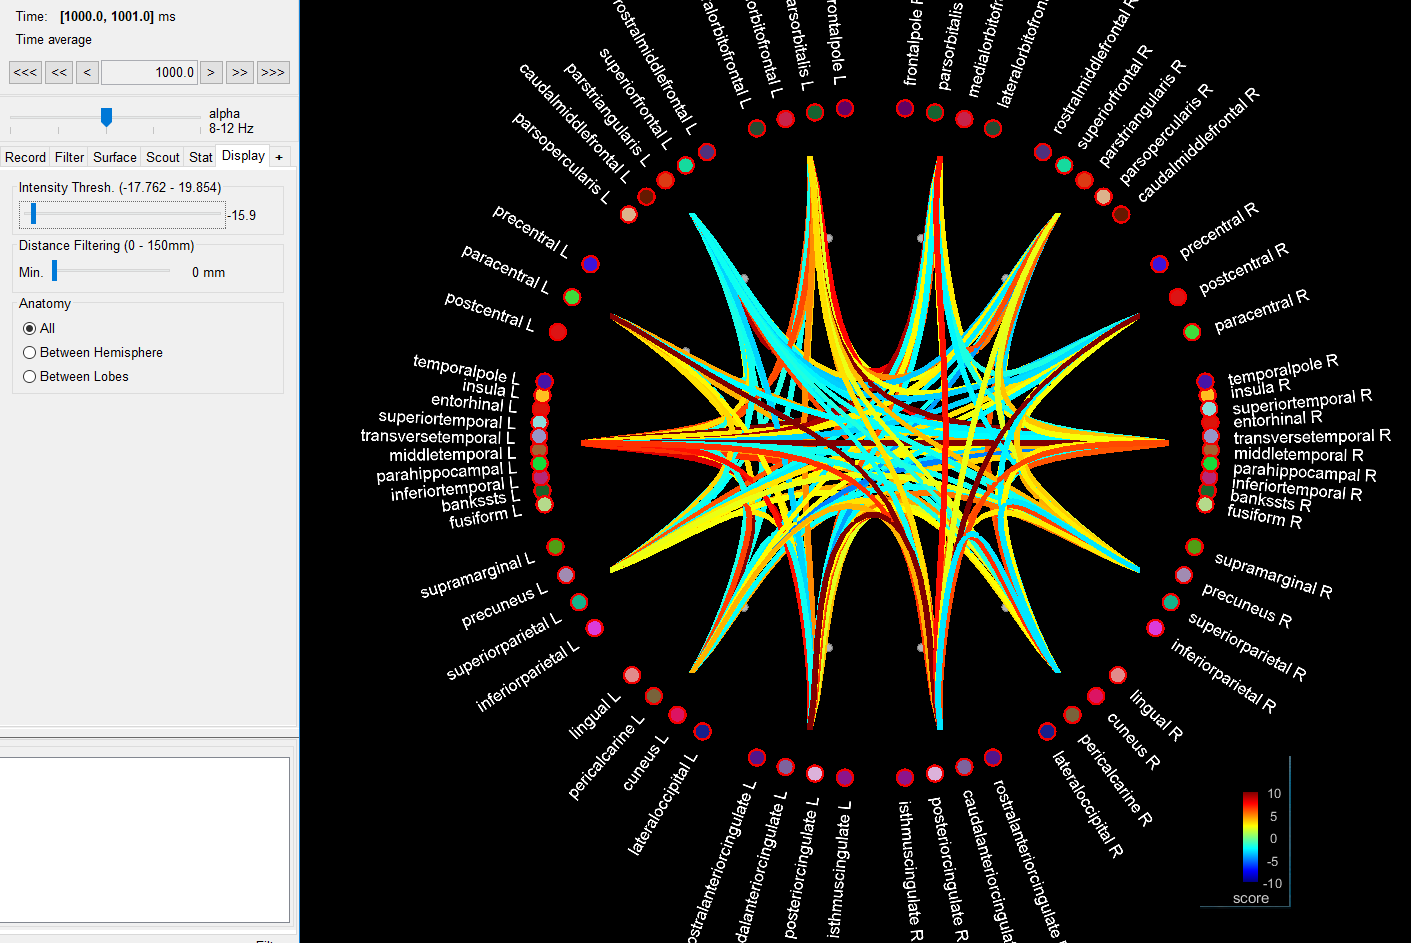
In the last picture, we activated in the Graph Options the "Display region Max" option,
and now we got some blue links also visible.
Hopefully these pictures help!
T & H