Yes, we should even disable this slider, as we do for the statistical results on the source maps...
Only positive links appear.
Probably because the colormap is configured to display only absolute values.
Right-click on the figure > Colormap > Disable "absolute values"
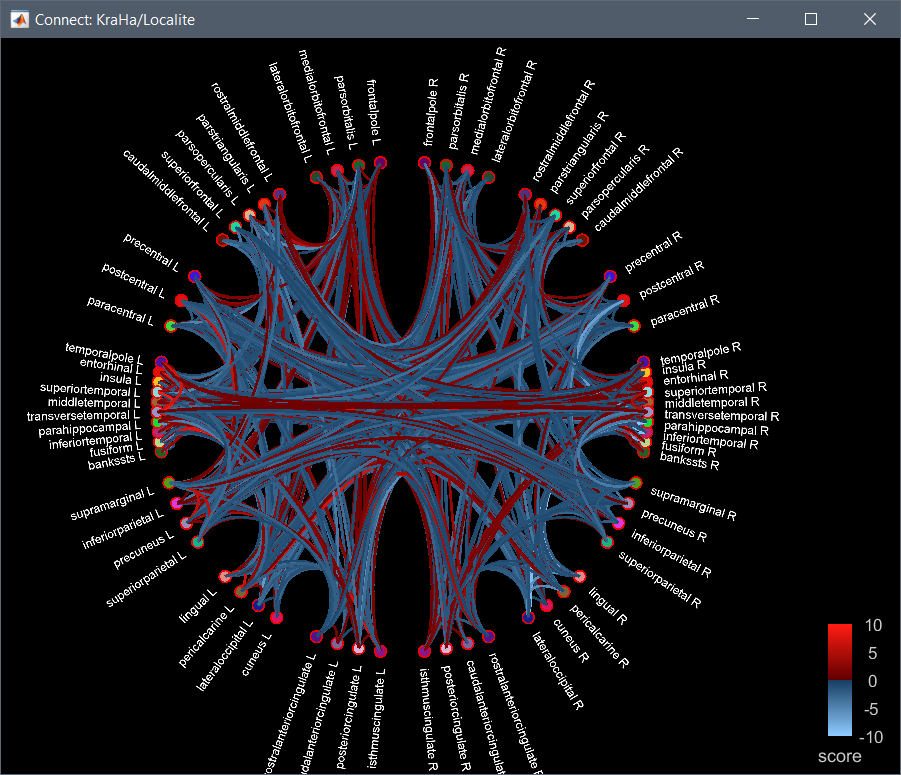
In the last picture, we activated in the Graph Options the "Display region Max" option,
and now we got some blue links also visible.
This one is a bug, I tried to fix it in this commit: Bugfix: Absolute values with regional maximum · brainstorm-tools/brainstorm3@889ee0a · GitHub
Update Brainstorm to get this fix.
=> @MartinC Could you check that this fix looks good to you? I'm a bit confused with the way the colors are handled in this function...
If you have any doubt, with these connectivity graphs, use the image display instead. This is much more reliable.