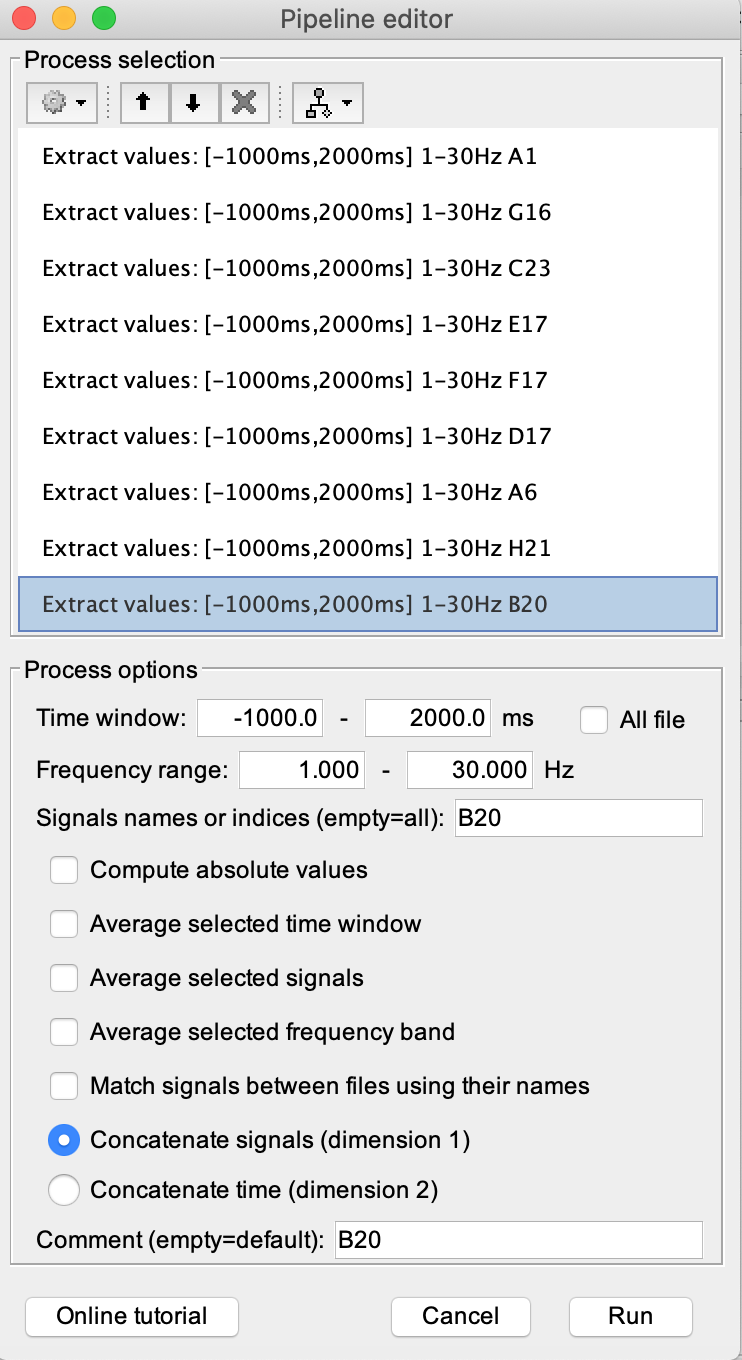
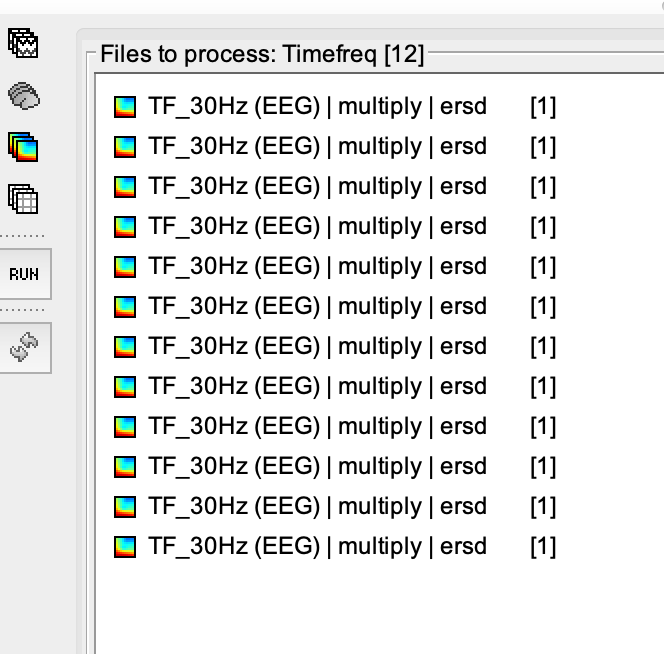
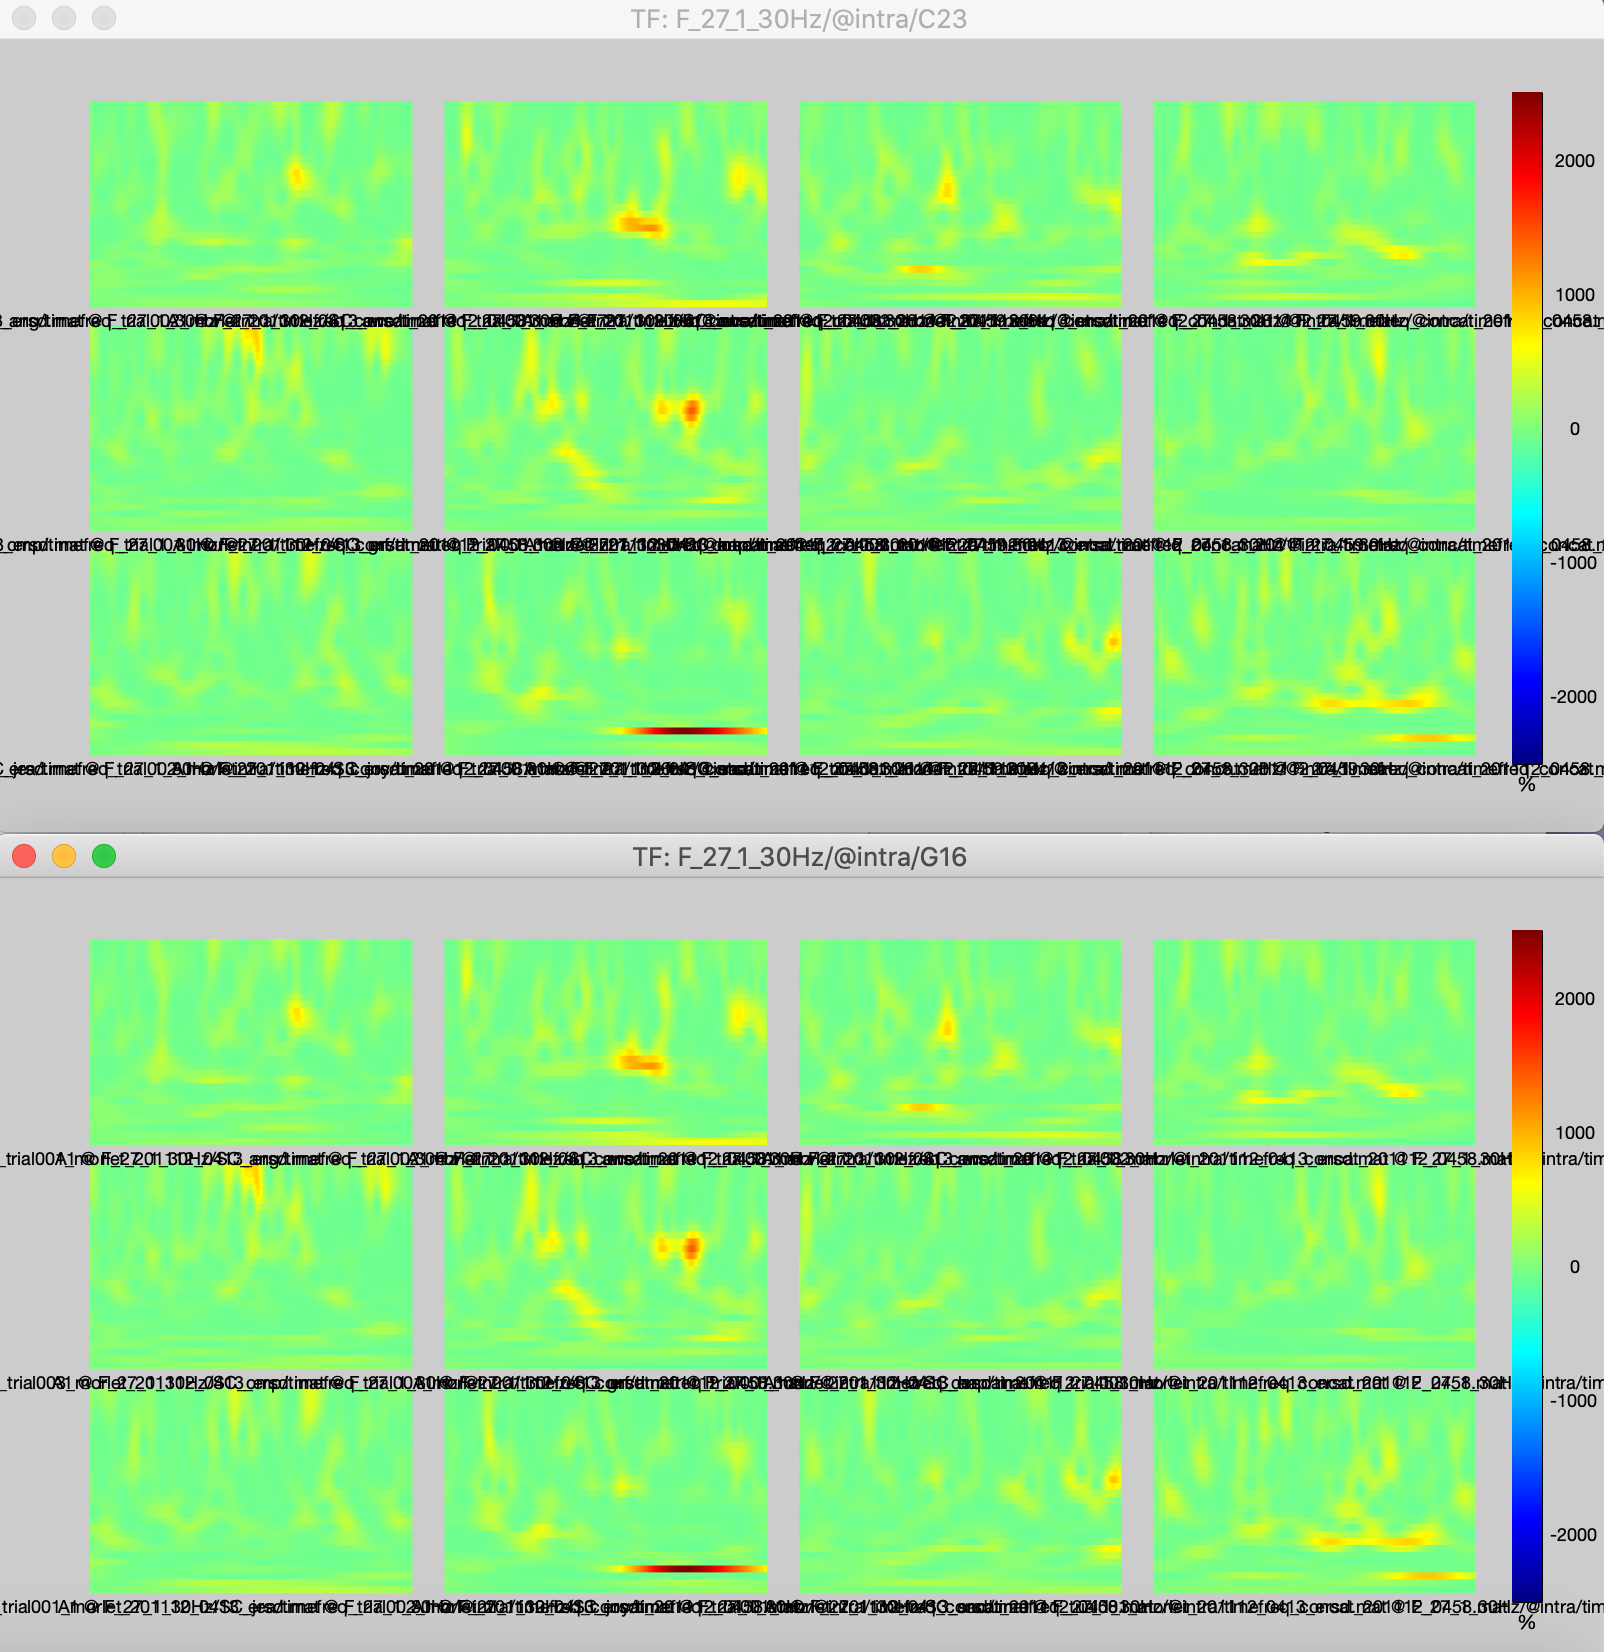
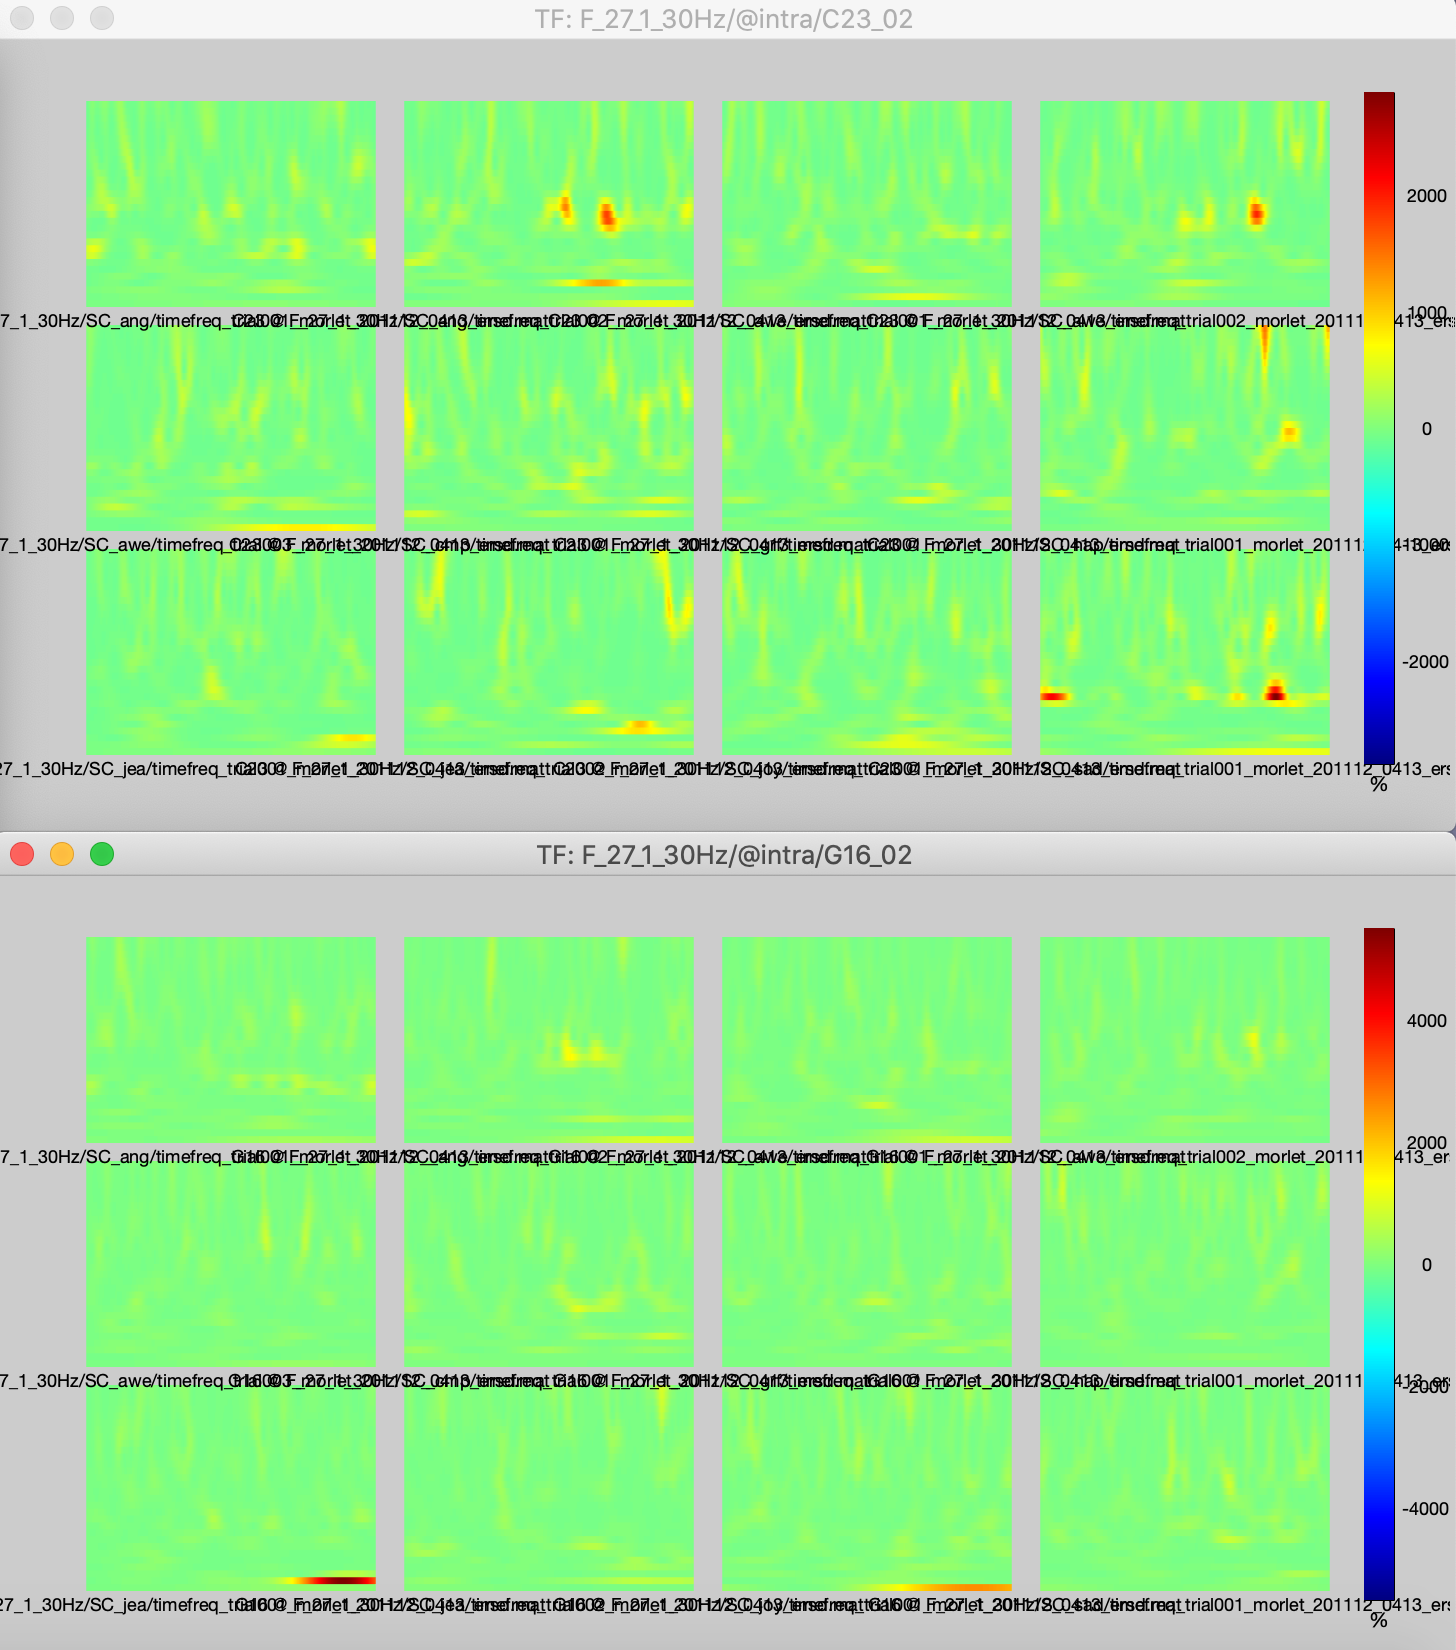
I created a pipeline to extract signals of different conditions from 9 different sites (pic 1&2), so the visual representation for each site should be different, but then it gave me same figures (pic 3). I am showing you just figures from two sites (C23, G16), but all the figures were the same. I tested it by running Extract separately for the site C23 and G16, it returned different figures (pic 4). Could you please let me know what I did wrong?
If you select only one channel in the first process (eg. A1), the second process receives one file only in input: the channel A1 extracted for all the files you had initially in your Process1 list. The requested selection of a second sensor (G16) fails (and probably returned a warning or an error), and returns all the data in input.
If you want your script to behave differently: generate the corresponding Matlab script, and for all the processes, use the initial sFiles variable, and get the output of the various extraction processes in variables named in different variables (eg. sFilesA1, sFilesG16...)