Hi. Is it possible to plot a 2D disk with the actual values in a file? In this example, I have selected three channels that appear to have three different colors on the topo, but the values indicate I should have two red and one yellow. I guess there is some interpolation? Can I turn that off? It's a coherence result.

Hello,
There are 3 interpolations stacked in a typical “2D Disc” figure on MEG data:
-
The magnetic interpolation used to smooth the values based on a simple inverse/forward model. To turn this off, right-click on a file > MEG > No magnetic interpolations > 2D Disc. But this should not be applicable for connectivity or time-frequency values. Let me know if you have access to this option with your file, this is an error.
-
The interpolation of the 2D Disc: this is a stretched display, the values are interpolated from the sensors to a regular “disc” grid. This causes some smoothing. To turn this off: use “2D sensor cap” instead.
-
We have a discreet set of values, associated to the vertices of the grid in the “2D sensor cap”. The values are interpolated over the faces by Matlab (FaceColor=‘interp’). It is not possible to produce a 2D plot without any interpolation of this type, otherwise we cannot get a continuous surface, but simply discreet points.
Francois
OK, Thanks.
1). I do not have access to this interpolation from the connectivity plot.
2). Yes, I understand
3). This makes sense if the values are on a continuum, however, they are phase values, that I have computed and I don’t want to have fake interpolated phases in between two real values. I am trying to replicate a plot from a publication. I will have to find a way to extend the actual values along the surface.
Thanks!
This is not possible with the 2D/3D display functions with Brainstorm: the color values are always set “per vertex”, which means that to paint a face, there is necessarily a color interpolation between the 3 vertices of this face. Setting the color per face instead of per vertex is not as easy as it sounds, I can’t think of anything that would do this easily.
Option #1: You create a patch object with a ‘FaceVertexCData’ matching the number of faces (but I don’t know how you can set the values of the faces…)
https://github.com/brainstorm-tools/brainstorm3/blob/master/toolbox/gui/figure_3d.m#L3430
Option #2: You let Matlab compute one value per face, and disables the smooth interpolation across faces, by setting the property ‘FaceColor’ to ‘flat’ instead of ‘interp’ (https://github.com/brainstorm-tools/brainstorm3/blob/master/toolbox/gui/figure_topo.m#L168)
Option #3: You use a very high resolution for the sensors patch (add many tess_refine here: https://github.com/brainstorm-tools/brainstorm3/blob/master/toolbox/gui/figure_topo.m#L453), then replace the interpolation function with a nearest neighbor search instead of a distance-weighted interpolation (https://github.com/brainstorm-tools/brainstorm3/blob/master/toolbox/gui/figure_topo.m#L617). You would still have transitions between colors, but you could hope that the transitions are shorter. But I’m not sure the final rendering would look good…
Option #4: You set your sensors to “EEG” in the channel file, keep only one location per sensor and delete the orientation field, and display it with the “3D electrodes” mode: http://neuroimage.usc.edu/brainstorm/Tutorials/Epilepsy#Averaging_spikes (not very convincing…)
Sorry for not being more helpful.
Hello,
I would like to follow-up on this topic to ask about the options that we have with the EEG and for any new features introduced in brainstorm.
I have done power analysis on specific time segments of an EEG recording and I want to plot the results in 2D disc/cap.
- What kind of interpolation is used when plotting power with the 2D disc/cap?
- Is there a way of making it less smooth?
Thank you so much,
Georgios
What kind of interpolation is used when plotting power with the 2D disc/cap?
The smoothing over the EEG cap is computed here:
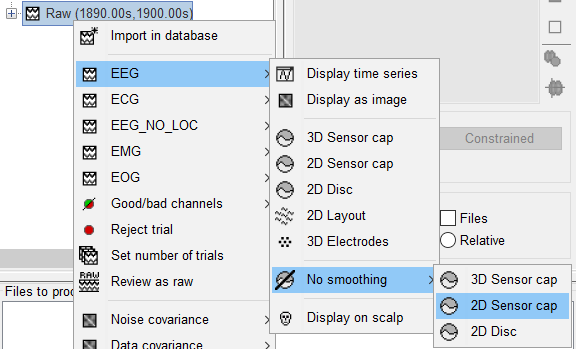
Is there a way of making it less smooth?
Yes, with the menu "No smoothing":