Hello,
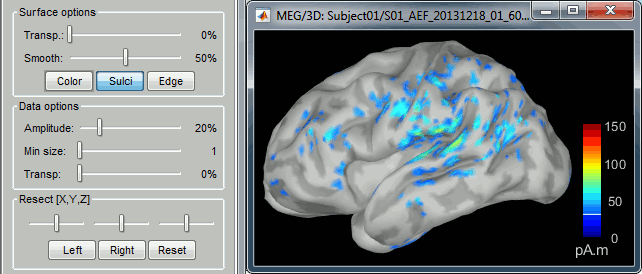
I am new to Brainstorm and I have two questions related to plotting data on the cortex surface. First, it seems that below some threshold the plotting algorithm switches to the default gray background. I'm interested in the minima of activation, and I'd like to see them plotted with colors from the lower extreme of the colormap, which they are not.
Second, is there an easy way to plot data from a matlab matrix? Right now, as a kludge, I export a 'sources' structure, set all columns of the ImageGridAmp field, and import it back. I guess the solution might involve view_surface_data() but I am not sure what to use for arguments.
This way would be in fact the simpler way to plot custom data on the cortex. If you want to call the plot function with a command (rather than the GUI), use view_surface_data() with only 1 arguent, the data to plot:
view_surface_data([], filepathFileToPlot));
The file to plot needs to be already in the database. The surface on which the file will be plotted is already indicated in the file. By using view_surface_data(), all the callbacks (figure clicks, colormap, GUI changes) are automatically handled.