I would like to create a video (or an image with several subplots) of my 6 sec window psd (obtained impoting 6 sec epoched data of 5 inutes), in order to observe how its psd topography changes over time, could you please create this option? I think it is useful to get a sense of data.
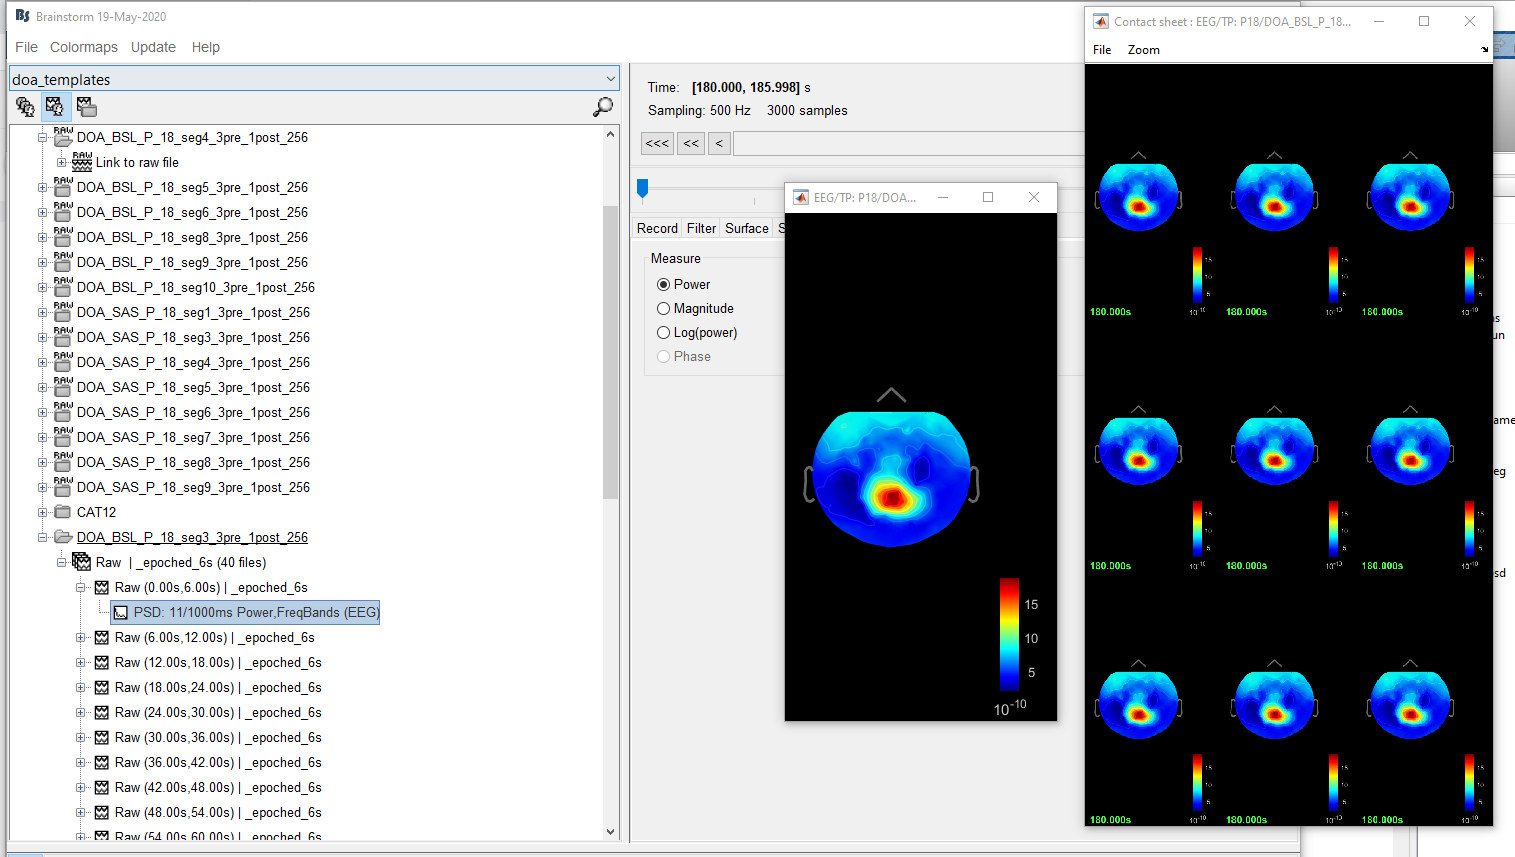
As you can see from the figure I divided a 4 minute segment into 40 blocks (6 sec each).
I computed the psd for each plot. I want to watch the movie in a specific frequency band from time 0 to time 4 minute (i.e. 40 frames in sequence).
It looks like you're trying with one single file that contains only one value (no time dimension), or that you right-click on the wrong file to get the 2d topography. The loaded time window at the top-right-corner of the Brainstorm window is [180-185s], therefore indeed, you can't make time movies.
Concatenate your PSD files first:
Select all your epochs in Process1, select the button "process time-freq" on the left, run process Standardize > Concatenate time