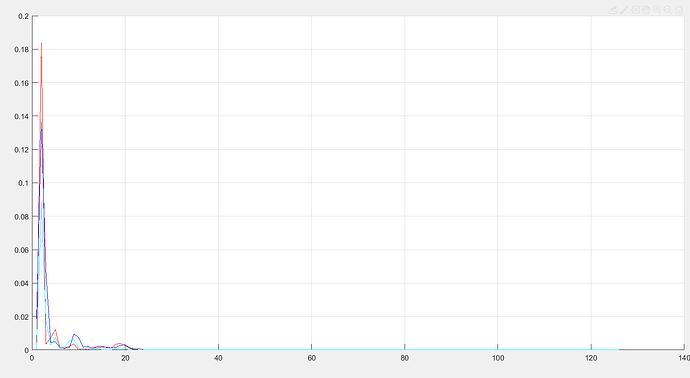
Hi there, I recently did PLS on the sources, and wanted to plot the PSD curves of the major sources. However I encountered something unexpected. As you can see in the plot attached, there seems to be no signal after 25Hz, could you please shed some light? Thank you so much!
Are your data low-pass filtered under 25Hz by any chance?
Please switch to log-log scale to appreciate what's happening beyond 25Hz.
