Hello
I am working on functional connectivity development in children's brains using EEG. I have a question
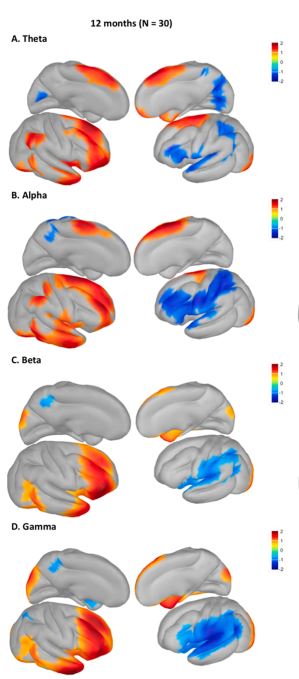
By displaying the PSD on cortex 12 month infants, I found that the output is as follows
As you can see in the figure above, the power distirbution of the regions is very strange!
Is the processing correct or has an error occurred?
I attached my processing pipeline. I would be grateful if you could help me
With respect,
Processing Pipeline.docx (1.5 MB)
The pipeline looks fine so far. One key step is quality control, including the removal of artifacts such as blinks and other physiological noise sources. You also need to check there are no bad channels in your recording and that the EEG reference is properly defined. This is all illustrated in the related tutorial sections.
1 Like
thanks for your reply
Do you think the source estimation for 1 year's old child is calculated correctly? Or is there a problem in the processing?
Because different findings can be seen in other similar articles.
Hard to tell until you produce spectral power maps in the different frequency bands as shown in the figure above.
The power spectrum map for 1-year-old child is as shown below
By comparing with the figure above, the difference can be seen. Did something go wrong with my processing? Because despite the same data, different results have been obtained.
It looks like there are major artifacts in your data that seem to affect all frequency bands: it could be artifacts like sharp transients (square waves or large spikes). You also want to verify that the sensor locations are properly positioned on the scalp, as another sanity check.
A couple of possibilities:
(1) Poor ref point/connection
(2) Offset removal inadequate.
3 Likes