Dear all,
I face a problem in extracting scouts time series.
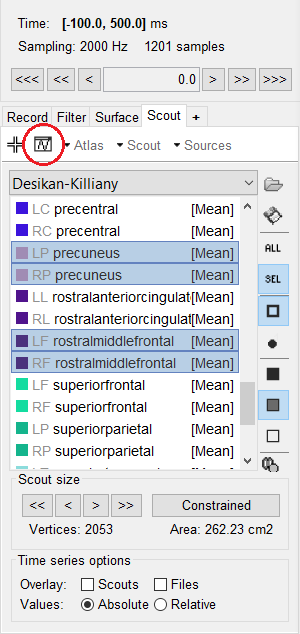
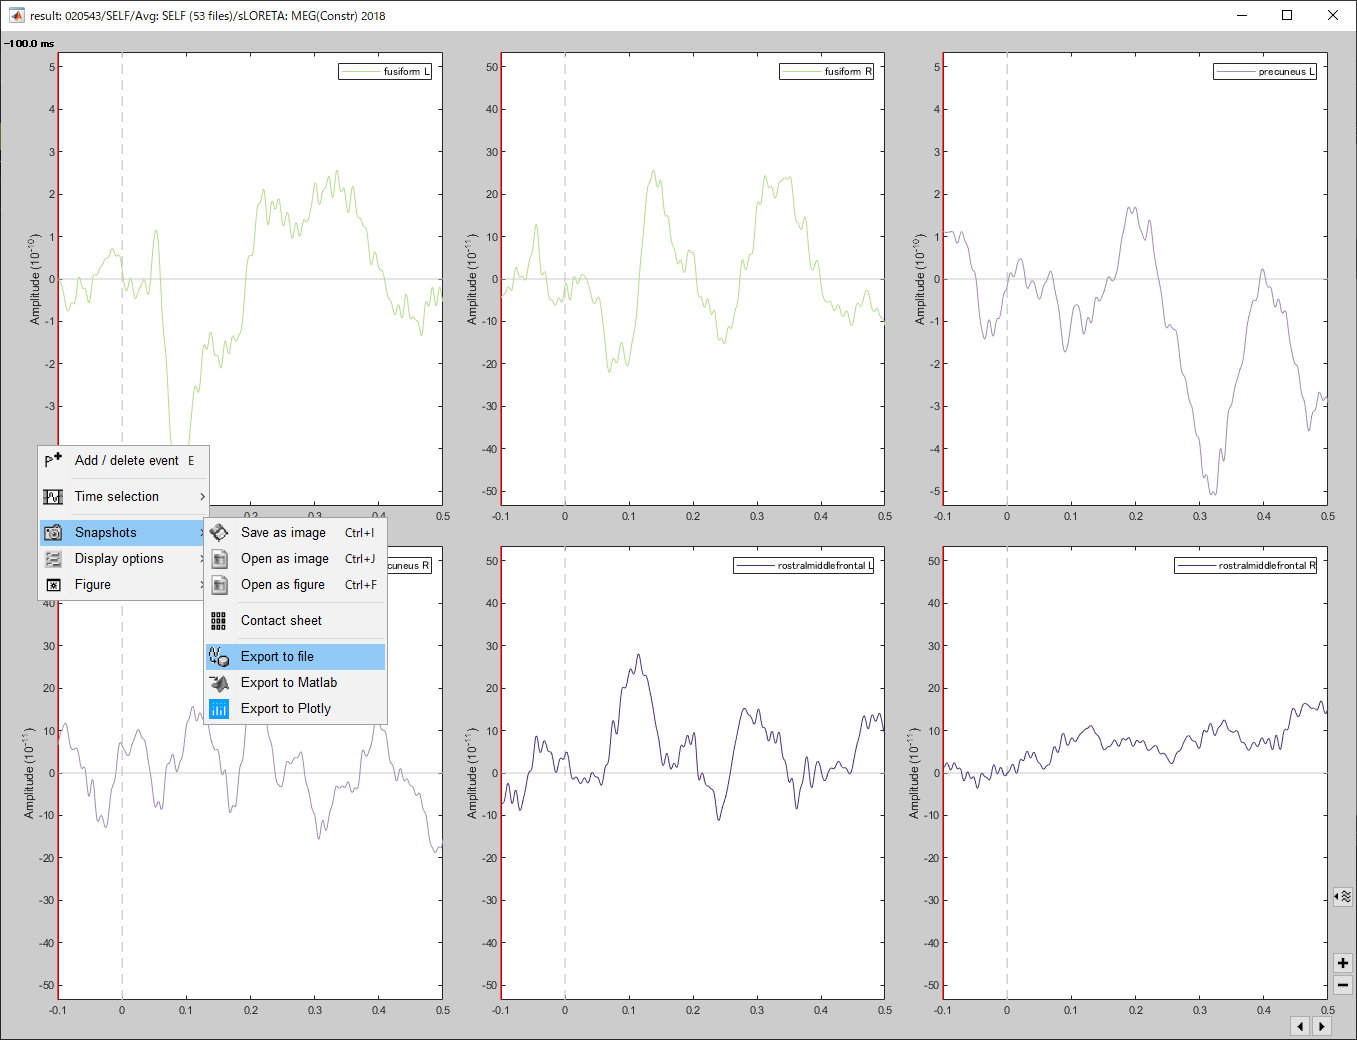
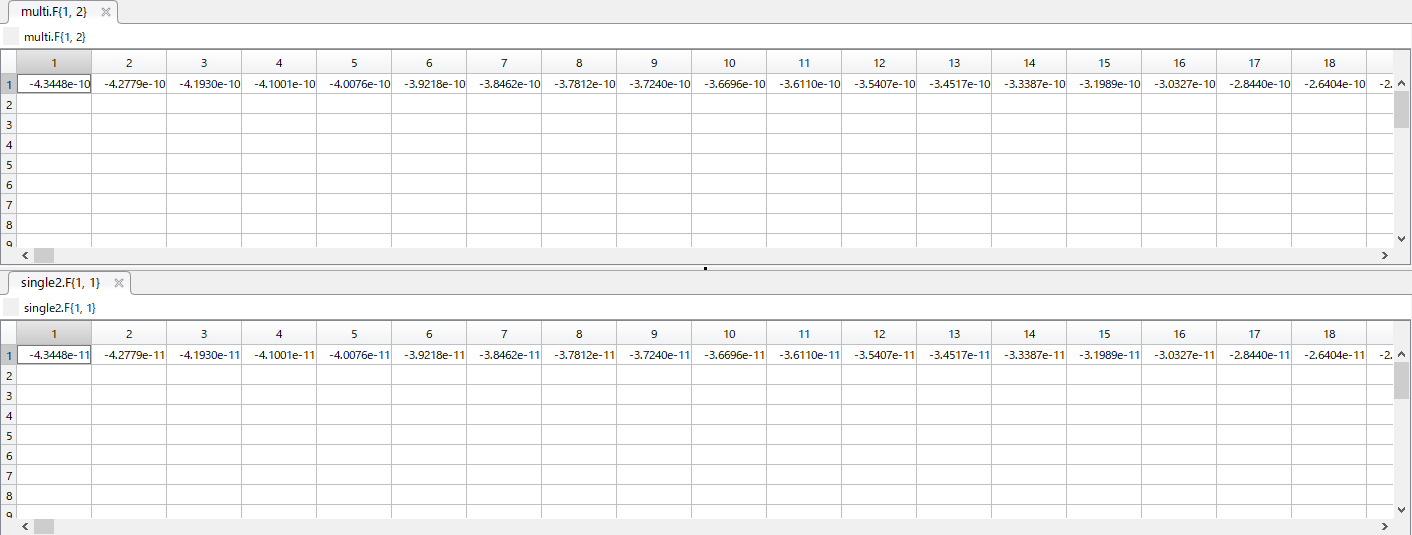
After computing sources using sLORETA or other methods, I choose multiple scouts at one time, check waveforms by “Display scouts time series” (Figure 1) and extract time series by Snapshots -> Export to file (or Export to Matlab) (Figure 2). Then, all values of some scouts are just 10 times larger than when choosing one scout each and extract values by the same procedure (e.g. -4.3448e-10 <-> -4.3448e-11; Figure 3).
Which scout has this deviation depends on the participant and condition, but the same scouts always show this problem in the same condition of the same participant.
Also, this phenomenon arises whether I select “Absolute” or “Relative” in the “Time series options” and whether “Mean” or “FastPCA” function.
I have not been able to confirm this problem except for the values computed by sLORETA so far (I checked out some values by Minimal norm imaging, but I could not find the same phenomenon).
I speculate that this problem may be occurring when plotting several Figures at one time because this does not seem to occur when extracting values from “Process -> Extract -> Scouts time series”.
I’d be grateful if you could confirm this problem and tell me which value is correct.
My environment is as follows.
Brainstorm: 12-Feb-2020
MATLAB: R2019b
OS: Windows 10
Best regards,
Ken