Hello,
I have a .mat file which is of size 69*2478166. This is an EEG data extracted from a fif file. I specifically want to use .mat file. I selected the file format as "EEG: Matlab matrix (.mat)" format too. In the following figure, I have put 512 as sampling frequency which is accurate. [Channels * time] is also correct as per my .mat file's dimension. I did nothing to other fields. When I import the data and try to see the data, it shows nothing in the graph after importing is done. My .mat file has EEG data which I can see using matlab commands. I have no idea what is the problem. Why can't I see the eeg signal in the graph. I would be glad if you helped me. 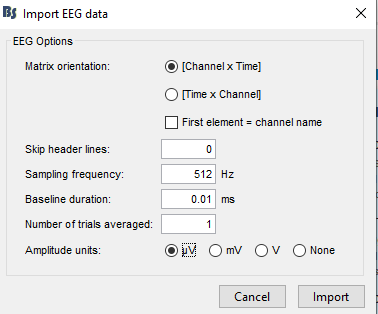
I selected the file format as "EEG: Matlab matrix (.mat)" format too.
If you want to use directly a .mat file, the data must be available in a field directly available in the .mat file you read. If there are other fields, the import function should ask you which one to use as the data matrix to load. For example:
test = load('test_file.mat')

test =

  struct with fields:

      EEG: [69x2478166 double]
In the following figure, I have put 512 as sampling frequency which is accurate.
What is this "Baseline duration = 0.01ms"?
If you want t=0s to be the first sample in your file, use 0 ms here.
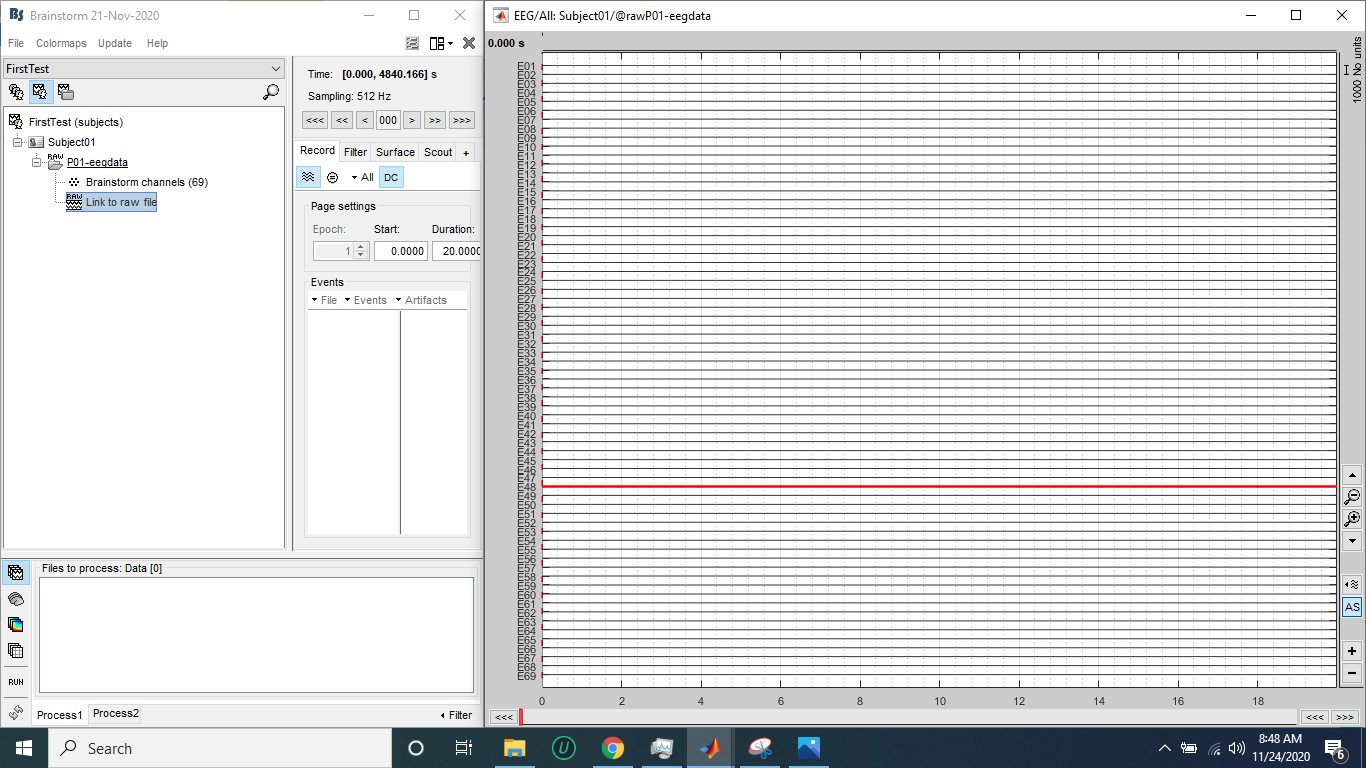
When I import the data and try to see the data, it shows nothing in the graph after importing is done
Can you show screen captures of what you mean with "it shows nothing"?
To check that the data was correctly imported: right-click on the file > File > View file contents. Please post a screen capture of this as well.
Thank you so much for your response. I have done the same process to import the .mat file in the following order.
- I first clicked on "review the raw file" and Import my file as "EEG: Matlab matrix (.mat)" and the following window appears and I selected as following:
Matrix Orientation: [Channel * Time]
Skip Header Files: 0
Sampling Frequency: 512
Baseline Duration: 0.00ms
Number of average trials averaged: 1
Amplitude Units: None - After clicking import and waiting for a few seconds, the import process was done and I could see the following information in File > View file contents:
Path: D:\Extras\BrainStorm\brainstorm_db\FirstTest\data
Name: Subject01/@rawP01-eegdata/data_0raw_P01-eegdata.mat
|- F:
| |- filename: 'D:\Extras\BrainStorm\brainstorm_db\FirstTest\data\Subject01@rawP01-eegdata\P01-eegdata.bst'
| |- format: 'BST-BIN'
| |- device: 'Brainstorm'
| |- condition: ''
| |- comment: 'P01-eegdata'
| |- byteorder: 'l'
| |- prop:
| | |- times: [0, 4840.166]
| | |- sfreq: 512
| | |- nAvg: 1
| | |- currCtfComp: 3
| | |- destCtfComp: 3
| |- epochs: [0x0 struct]
| |- events: [0x0 struct]
| |- header:
| | |- device: 'Brainstorm'
| | |- sfreq: 512
| | |- starttime: 0
| | |- navg: 1
| | |- version: 51
| | |- nsamples: 2478166
| | |- epochsize: 512
| | |- nchannels: 69
| | |- ctfcomp: 3
| | |- hdrsize: 7033
| |- channelflag: [69x1 double]
| |- acq_date:
|- Std:
|- Comment: 'Link to raw file'
|- ChannelFlag: [69x1 double]
|- Time: [0, 4840.166]
|- DataType: 'raw'
|- Device: 'Brainstorm'
|- nAvg: 1
|- Leff: 1
|- Events: [0x0 struct]
|- ColormapType:
|- DisplayUnits:
|- History: {'24-Nov-2020 08:20:57', 'import', 'Link to raw file: D:\ProjectEpilepsy\myProprocessing\Patient1\P01-eegdata.mat'}
- And then I double clicked on "Link to raw file" and the following graph appears in the "Diplay mode: column":
- I also tried to see the construction of my file in the matlab command window and I saw this information:
eegdata = load('D:\ProjectEpilepsy\myProprocessing\Patient1/P01-eegdata.mat');
eegdata
eegdata =
data: [69x2478166 double]
Is there anything I am doing wrong? I look forward to your reply.
Note: I had uploaded all the four images but the website does not allow me to upload more than 1 image as new user.
You only look at the first 20s of the file. Make sure that this is not only because of the display configuration (page duration, amplitude scale...) => display in "butterfly" mode, increase the gain, scroll through the file. If you are new to Brainstorm: start by reading the introduction tutorial to learn how to use the file viewer.
https://neuroimage.usc.edu/brainstorm/Tutorials
https://neuroimage.usc.edu/brainstorm/Tutorials/ReviewRaw
If you want to make sure your data matrix is read correctly: use the menu "Import MEG/EEG" instead, and then inspect the .F field. (maybe use a shorter time selection, as 5000s might be a bit long to display at once)
Note that we recommend to always use the native file formats instead of going through an intermediate step of Matlab import. If you are using a file format that does not seem to be supported by Brainstorm, please let us knowl
Thank you for your reply.