Hi,
I am having some issues when computing scout time series in resting EEG.
These are the steps:
Default anatomy Colin27
Create cortex_mixed as per the tutorial (I want to look at the cerebellum too)
Calculate the OpenMEEG BEM (volume) using default options
Calculate the head model using defualt options
Import scouts from the AAL atlas
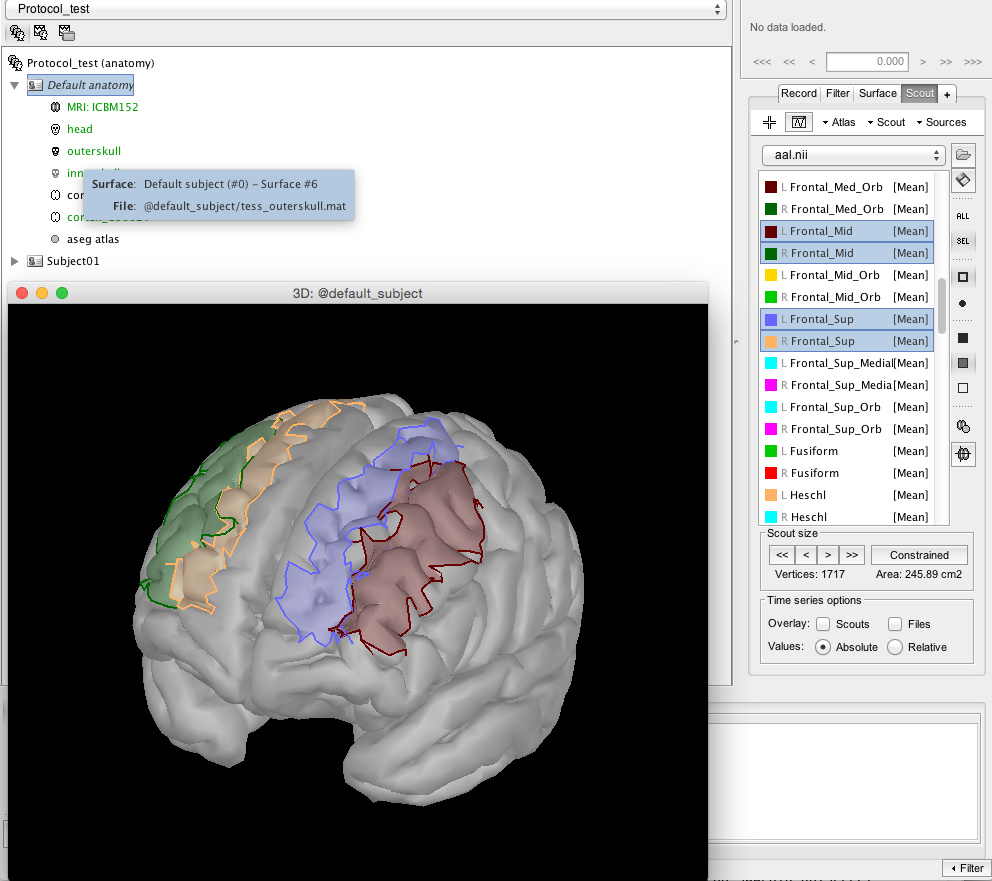
When I project the scouts onto the source grid, they all look fine.
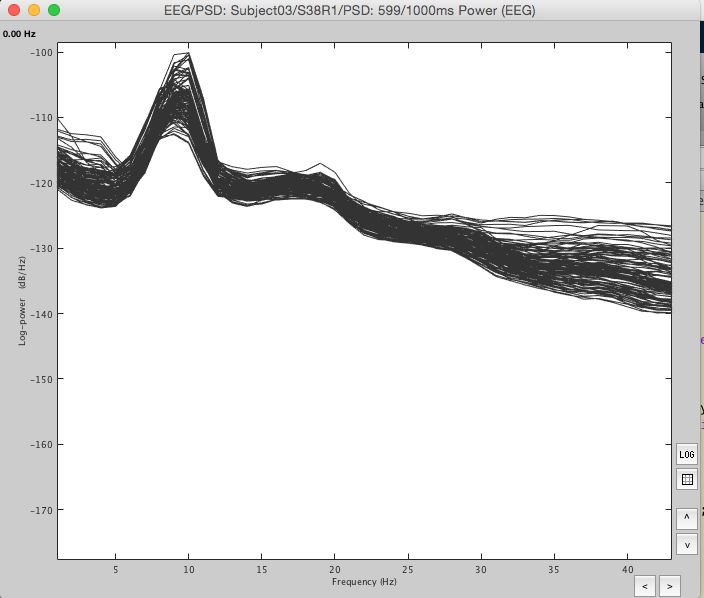
When I look at the scout time series for the volumes (mean, norm xyz) and then an FFT, I don’t see the familiar alpha peak. Instead the peak is at around 20Hz (however this depends on whether I use the 2016 interface or not). Either way, the scout time series seems oddly very much synchronised for all volumes. Coherence measures are only strong at this 20Hz peak.
If I do a similar process on my data using surfaces instead, everything looks normal (strong alpha peak). The activity in the time series for the scouts are not synched, they vary as you would expect in frequency & phase. Strong coherence is observed at alpha. However I want to look at deep brain structures so I can’t just use surfaces. Instead I figured I would just use volumes for everything.
Sorry, I must be missing something from the tutorials - are you able to assist?
Thanks very much
I create a new subject
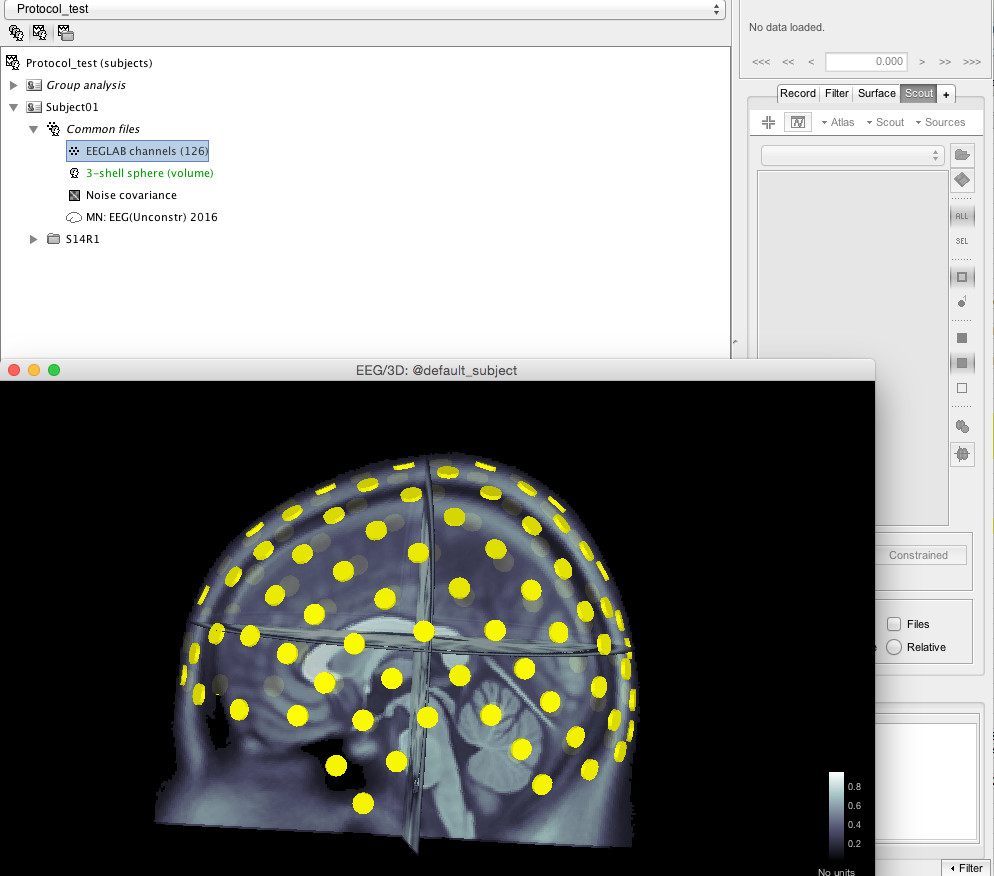
Import the EEG from an eeglab file
Right click on the EEGlab channels, Add EEG positions, ICBM152, Generic, ASA 10-05 343. It returns that all channels were found
Create a volume head model (in this case 3-shell sphere, have tried the OpenMEEG)
Create noise covariance, default options
Computed Sources 2016, default options
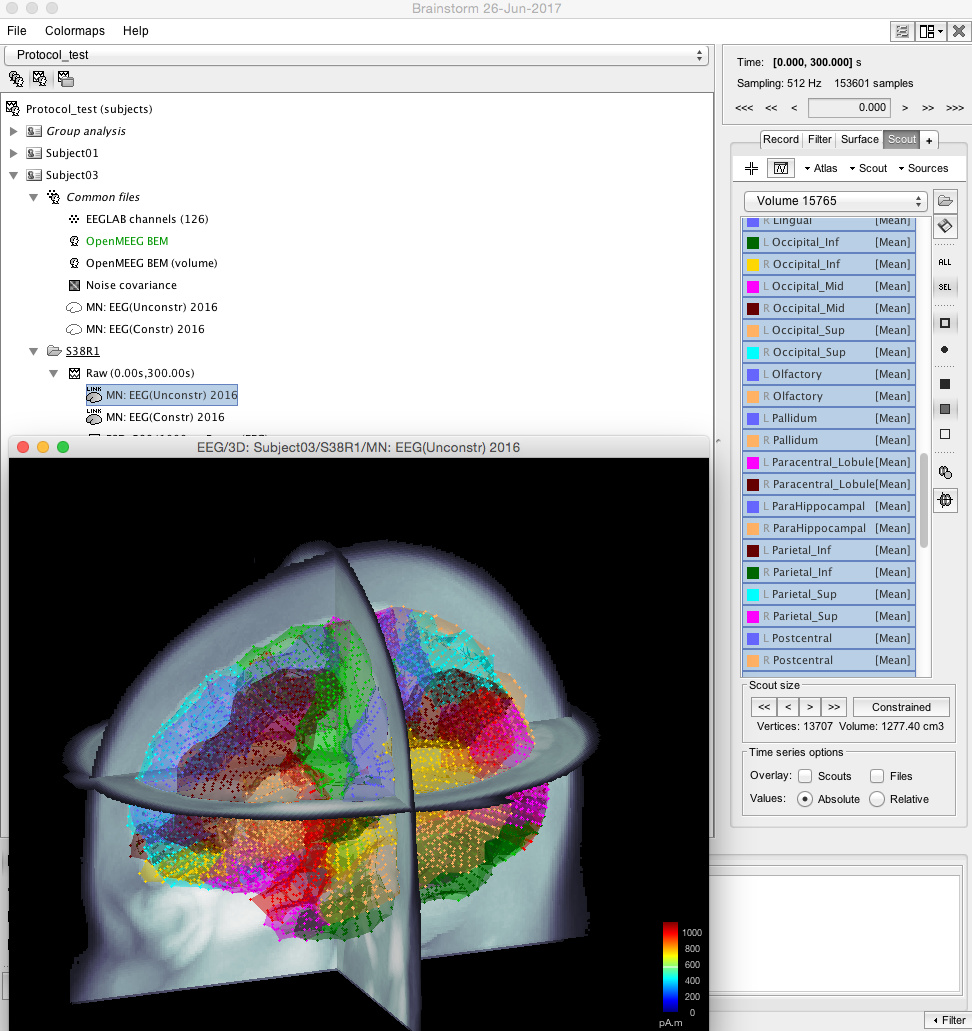
Double click on the MN: EEG(Unconstr) 2016
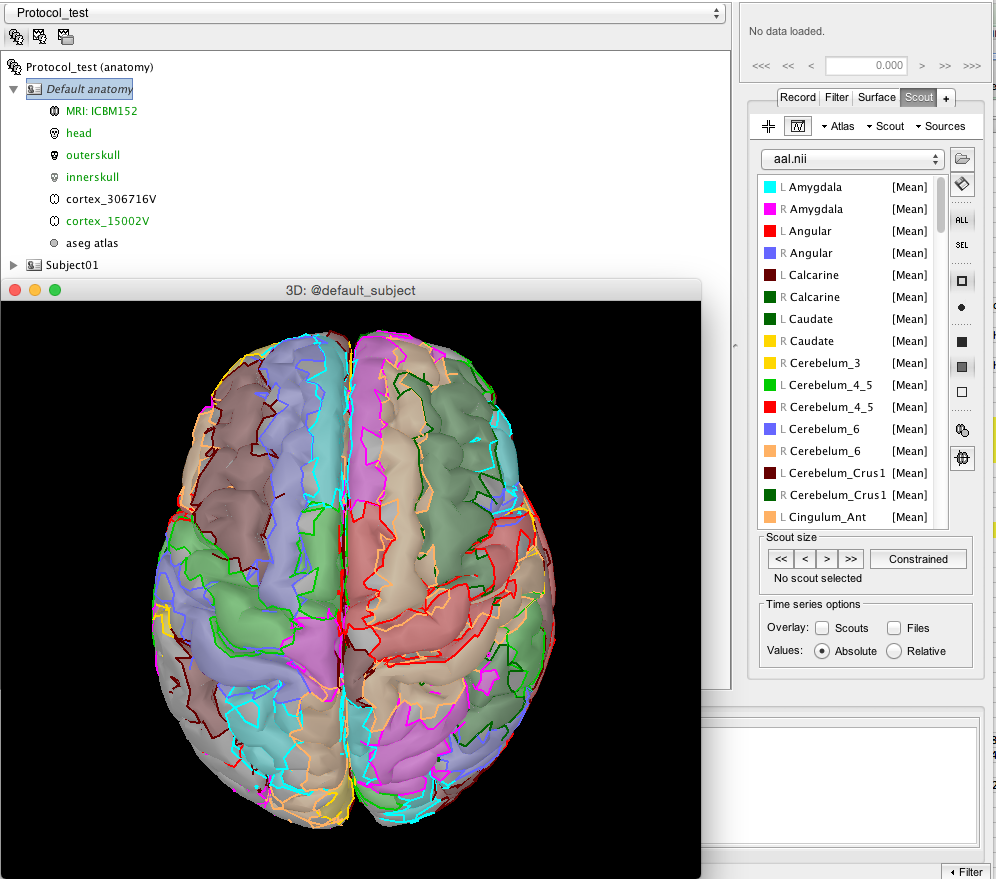
Go to Atlas, New Atlas, Volume Scouts
Go to Atas, Add scouts to atlas, "Volume mask or atlas (MNI space)", choose the aal.nii.gz. Scouts are created.
I now have a Volume 15765 atlas with the AAL structures inside.
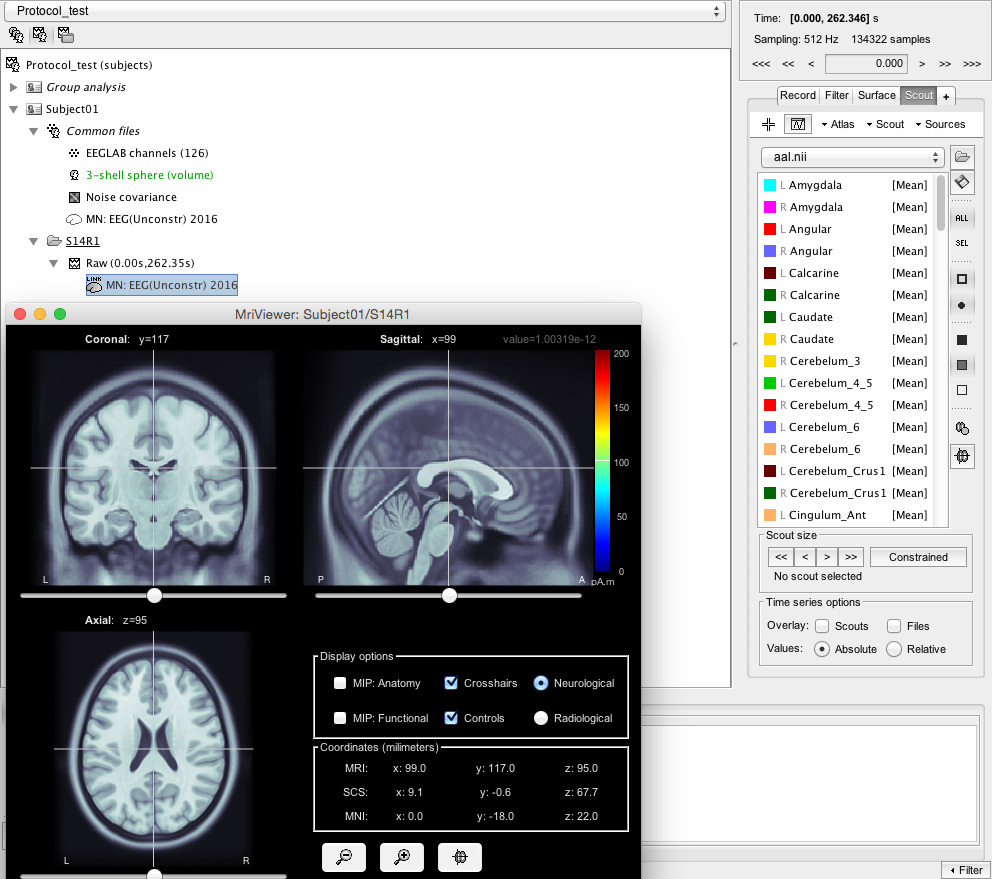
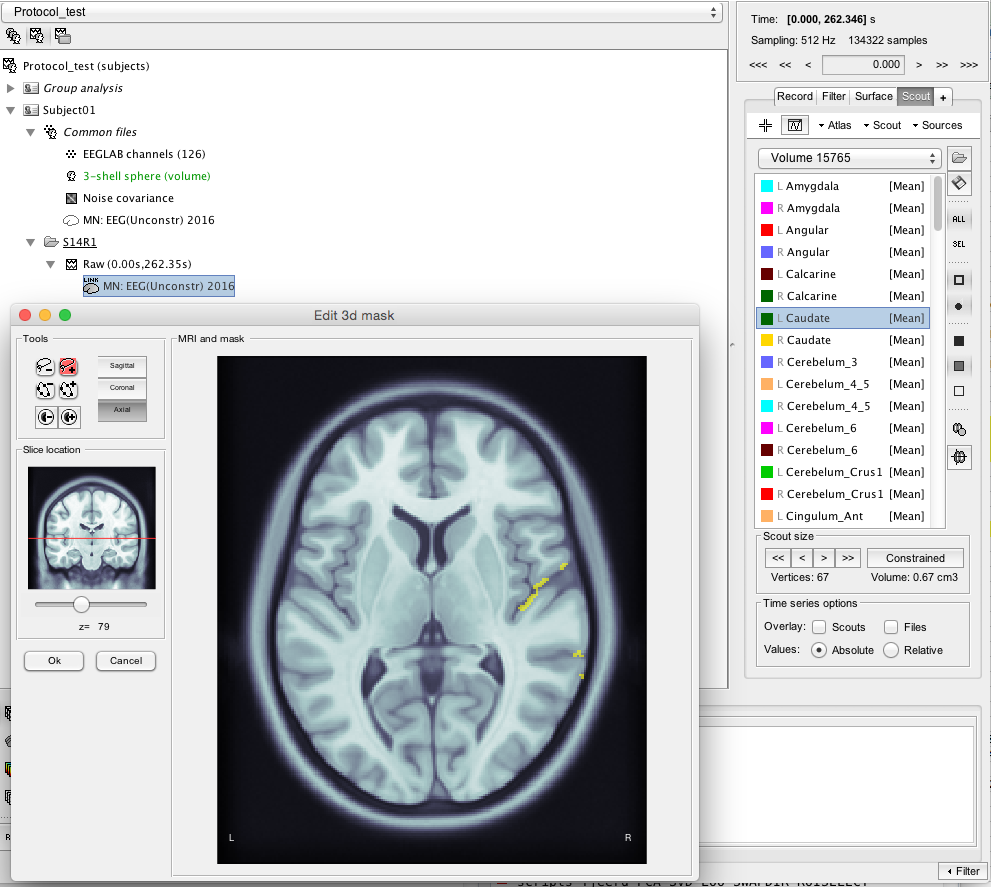
If I click on e.g. the left Caudate and go to Scout, Edit in MRI it looks very wrong: Same with all the other scouts.
I don't understand why the atlas looked aligned when I imported it the first time, but it is wrong when I add them as volume scouts.
Please could you help, I am clearly doing something wrong! If there is any other info or screenshots that I can supply please let me know.
Thank you very much.
Please do not rely on this menu Scout > Edit in MRI (your last screen capture), it doesn’t work for volume sources. I didn’t catch this issue before because we do not use it much. I will add an error message to prevent these wrong interpretations.
I forwarded your messages to other collaborators for your questions about coherence.
Then ran the full OpenMEEG default options for Surface and Volume.
I then did Sources 2016, default options.
Then scout time series using the AAL as surfaces and then AAL as volumes, default options (mean, norm of xyz for volumes)
Computed coherence and looked at the spectra of those (right click Power Spectrum)
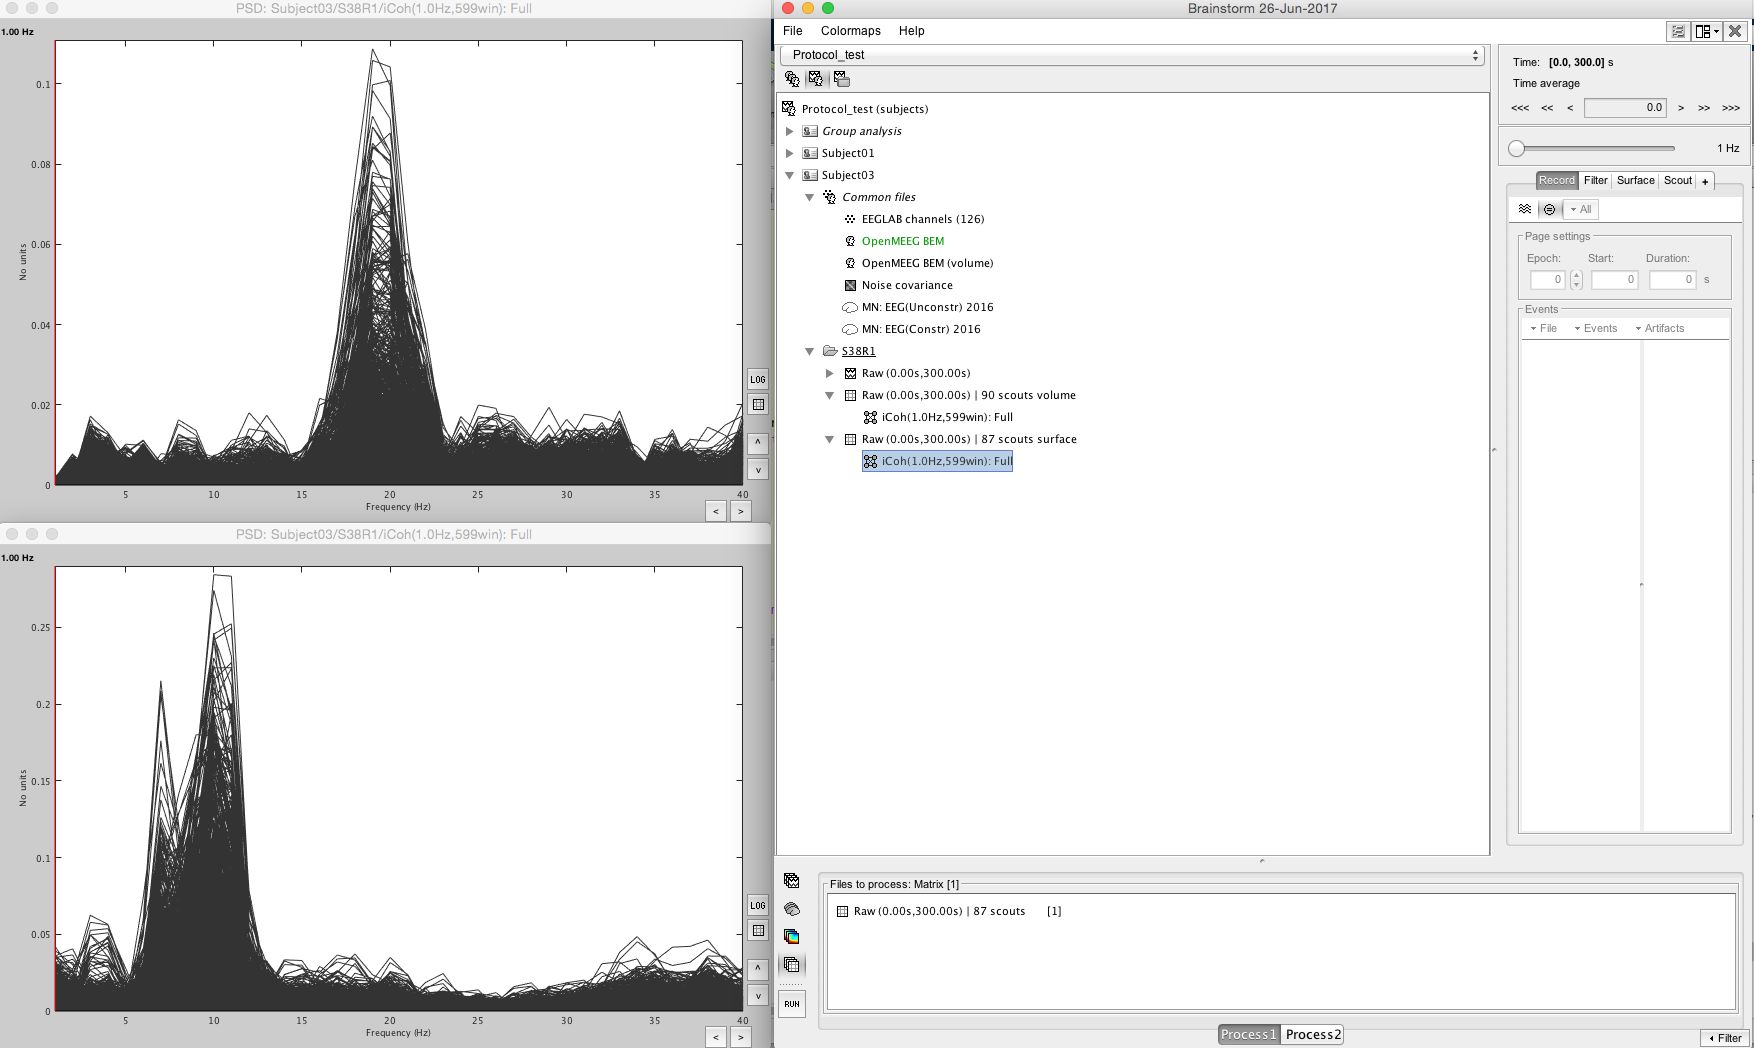
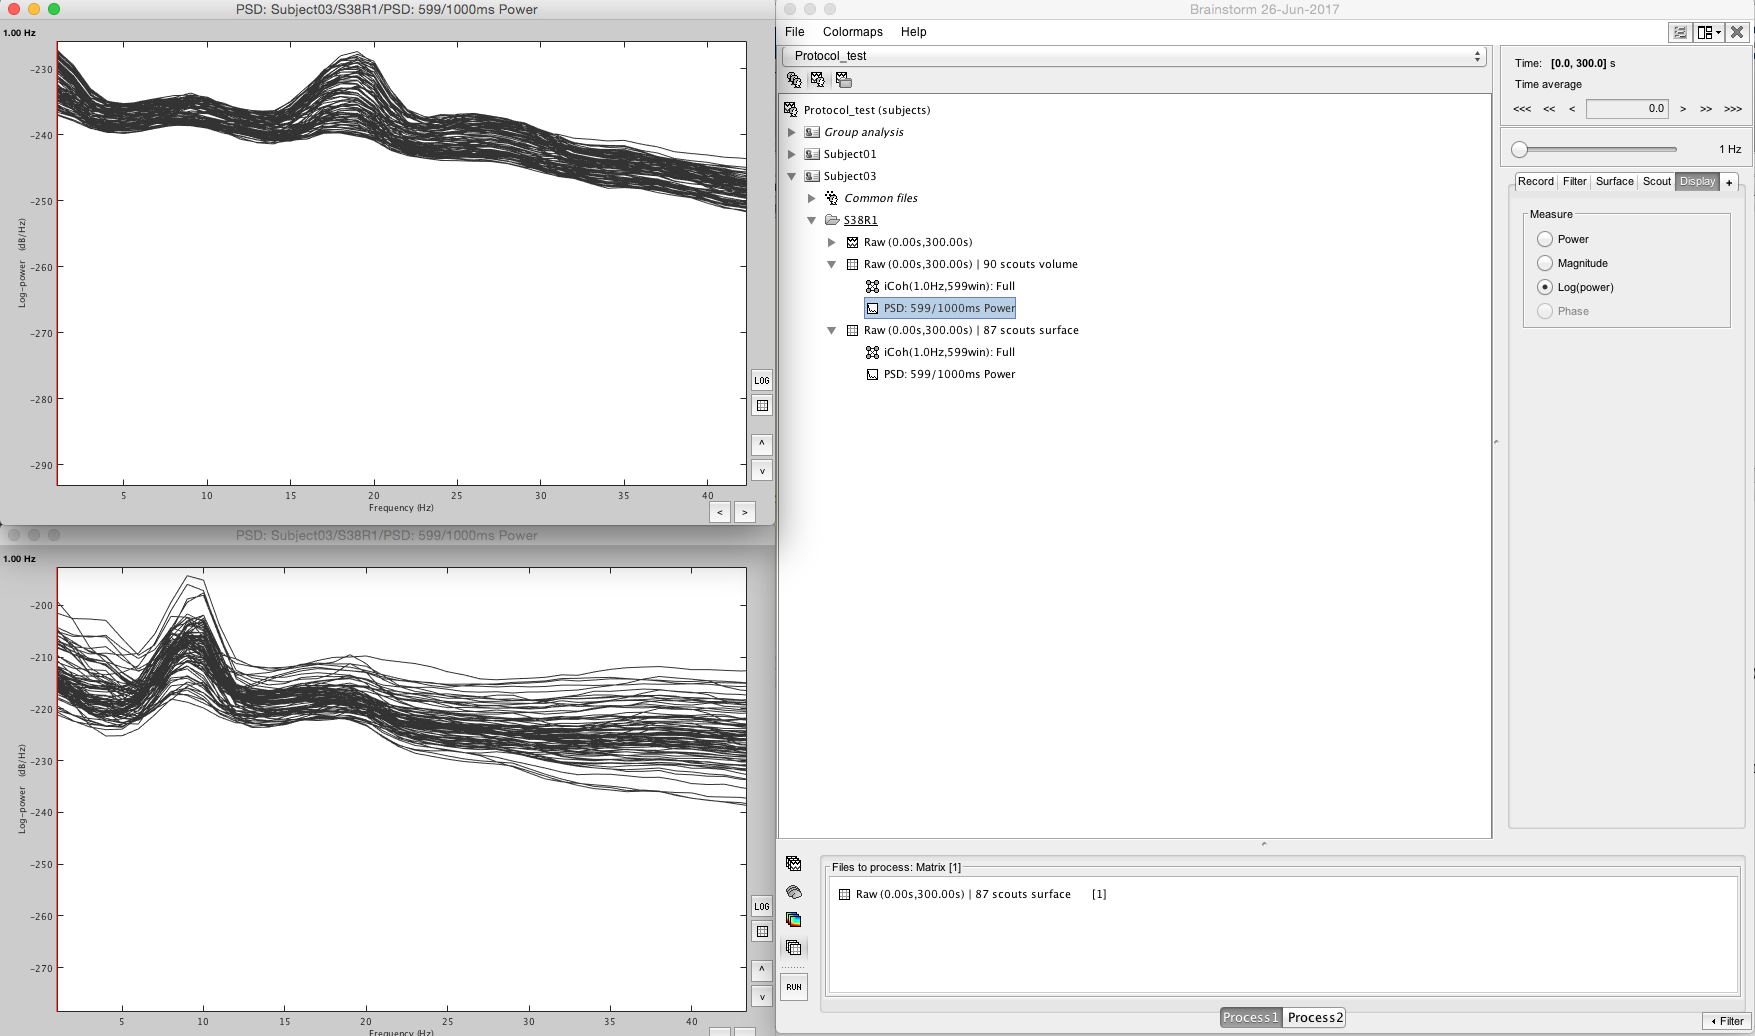
Here is a demonstration of the different spectrum issues (top is Volumes, bottom is Surfaces):
This lack of alpha peak is what I am seeing regardless of subject data, however sometimes the spectrum for the volumes is more uniform across frequencies depending on method used. Also, the PSD for the scout time series looks similar to the coherence spectra so it is in the Raw EEG -> Scout time series conversion that something isn't right. Either way, there is a big difference between the two spectra (surface and volume)
There are a couple of issues you need to consider before this comparison.
First of all, try to compare the PSD of raw EEG, scouts’ time series for the surface, and scouts’ time series for the volume. If you apply the same approach for surface and volume source reconstructions, you should at least see a similar pattern for surface and volume.
Here, you have computed 1 x N connectivity, in which you need to specify one scout as the source. Since you wanna compare surface with volume, your source is not the same in two cases, besides the thing that all sinks are also different. So, if you want to perform a comparison in this way, select the scouts as the source, in which they have a high overlap between surface and volume.
At this time, I recommend using magnitude-squared coherence instead of imaginary coherence to you.
Please note that coherence is a measure of pairwise correlation in the frequency domain. This measure is divided by the power of each variable. I do agree that if you see an alpha peak in all channels, you expect a high coherence between all pairwise channels, but don’t forget the correlation and normalization.
My observation on resting-state MEG (comapring networks computed by the signal on sensors and surface scouts) is that you should see a somehow similar pattern (especially in alpha band).
Hope it works for you,
Hossein
(Brainstorm Software Collaborator)
With your last screen capture, I understand better what happens and why your 10Hz peak disappears.
You extracted the scouts time series with the process “Extract > Scouts time series”, which does different things for different types of source models. In the surface/constrained case, there is one signal per source point and the sign is preserved in the output signal. In the volume/unconstrained case, this process takes the vectorial NORM of the three orientations: sqrt(x^2+y^2+z^2).
In the volume/unconstrained case, the sign of the signals is lost (the signal for each orientation is squared), causing important changes in the spectrum of the signal. The rectification of the signals causes the oscillations at 10Hz around 0 to be transformed in 20Hz patterns. Something similar would happen if you observe the spectrum of a function abs(sin(t)) instead of sin(t).
We still don’t really know how to group these three orientations in the connectivity analysis. Computing connectivity measures for unconstrained source models is tricky. But you can already get better results by running the coherence process directly on the source files, and selecting the scouts you are interested in. Select “Apply scout function: BEFORE”, otherwise it will try to estimate a 30000x30000 connectivity matrix, which will crash your computer.
What the process will do is compute separately the connectivity measure for each orientation and each scout (3x3=9 values for each pair of scouts), then get the maximum measure for each pair (max of 9 values). This is arbitrary and unstable, but this is what is done for lack of a better solution at this time.
Working on the surface and with constrained orientations definitely make things easier to compute, display and undrestand.
The corresponding code is in bst_connectivity, line 567:
Unfortunately those were NxN coherence calculations![quote="hossein27en, post:5, topic:3261"]
At this time, I recommend using magnitude-squared coherence instead of imaginary coherence to you.
[/quote]
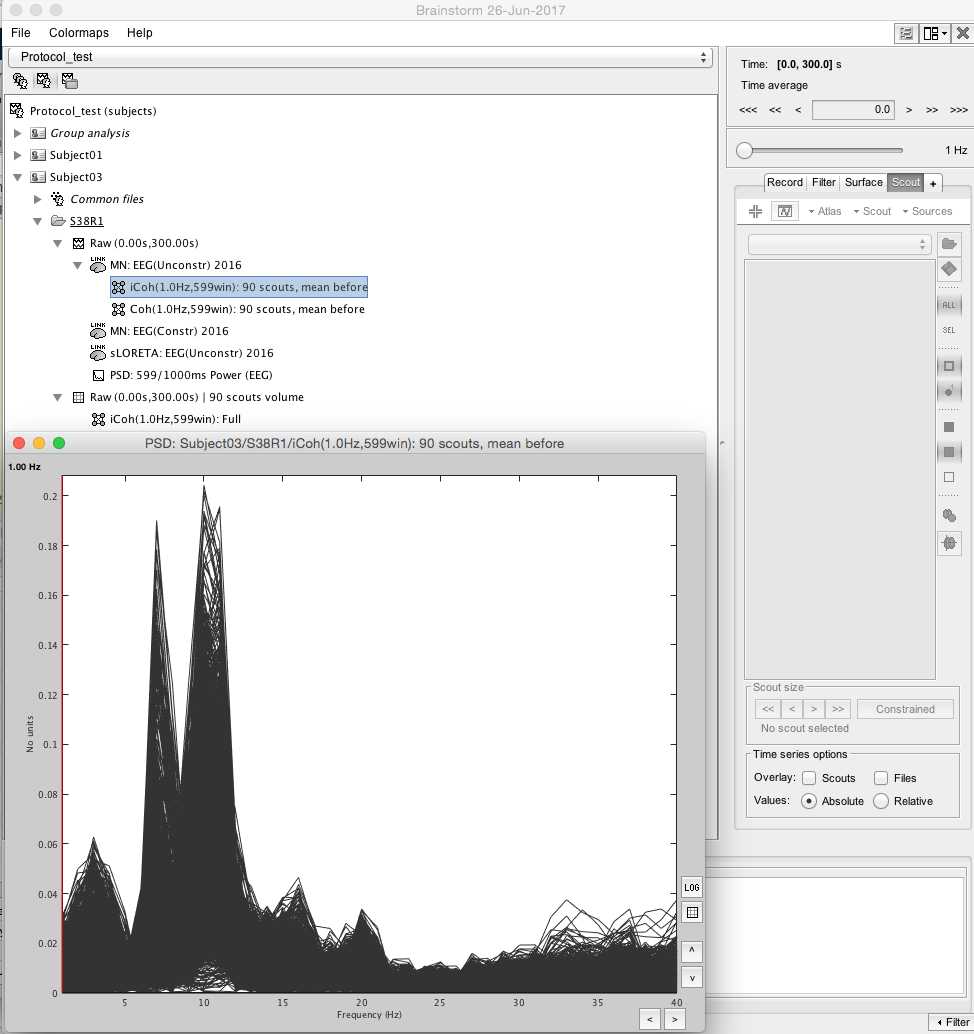
Tried magnitude squared and I don't know quite how to interpret it - but it still seems to have a 20Hz peak unfortunately
I think this might be what Francois is referring to in that the normalization is having an effect?
So that's great that I have a spectrum that corresponds! It is returning 90x3 = 270 values - Is there a method in Brainstorm where I can get a coherence measure that is the maximum i.e. just 90 scouts? I tried to add the coherence results to the pipeline but I couldn't see how I could reduce it to just 90 scouts.
I would rather use Surfaces because they are clearly easier to interpret, but I was under the impression that they weren't valid for deep structures - is this right? If I can use surfaces, I would prefer it if it is OK.
A question is: how does this analysis compare to the CARTOOL software Volume analysis - is it the same?
I'm not sure what you refer to... The NxN coherence with the options configured as mentioned before, you should obtain one value per pair of scouts. Try with simply two scouts to understand what is going on.
If you think you are not getting what you should, please post a screen capture where you see this "3x90" values.
Sorry - I was confused because it said that it was doing 90x3 coherence calculations - but as you said, it does the process internally and the result is 90. So I select scout function 'mean' and then when to apply is 'before' and the function will return the max value of the 3 orientations.