Hello,
I did statistic test for source using Desikan–Killiany atlas as scouts, and I displayed the result as table, but found the table was a .mat file. I'm wondering that if I can export the table in this mat file into excel file?
Hello,
I did statistic test for source using Desikan–Killiany atlas as scouts, and I displayed the result as table, but found the table was a .mat file. I'm wondering that if I can export the table in this mat file into excel file?
you can check on the menu> right click, > file > export to >
You can also convert the mat file to csv from matlab:
FileData = load('FileName.mat');

csvwrite('FileName.csv', FileData);
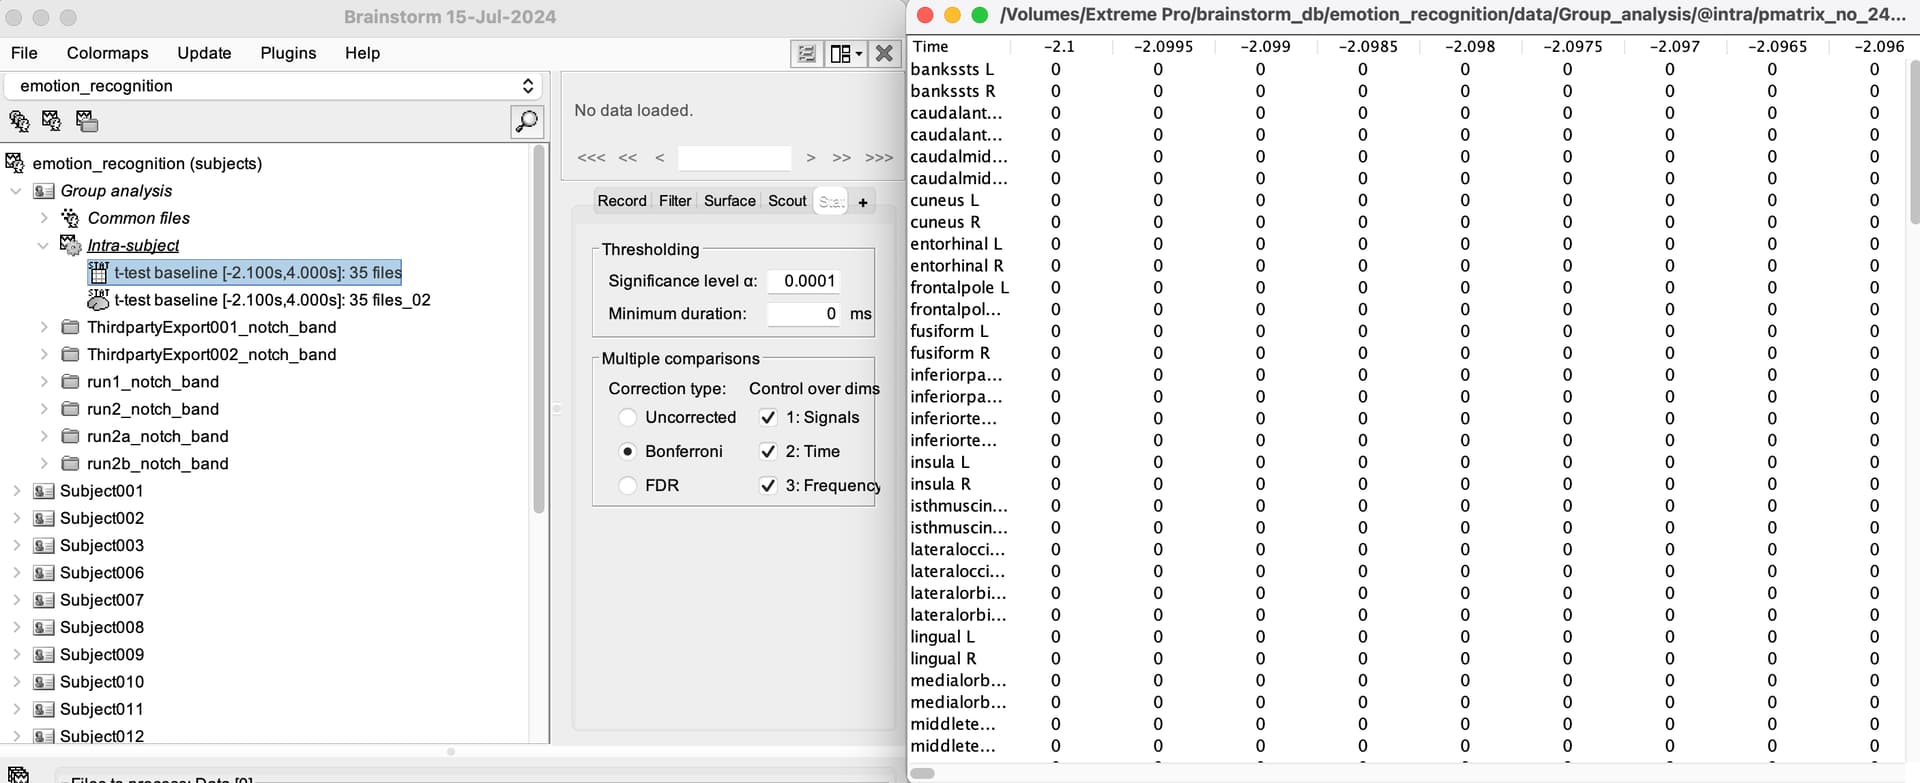
When the results of a statistical test are open as table open, theThresholding parameters ( Significance level α and minimum duration) and the Multiple comparisons parameters (Correction type and Control over dimensions) are used to masks the statistic values.
![]() The table is not updated if the parameters in the Stat change
The table is not updated if the parameters in the Stat change
With this said, to export this table, your need:
Run the process Test > Apply statistic method on the result of the statistical test (![]() ).
).
This will create a new matrix (![]() ) file that only contains the statistic values after masking
) file that only contains the statistic values after masking
In the new matrix file, right-click File > Export to file. Herein you can find Excel as a output format
Thank you very much. I've exported the excel successfully !
@Raymundo.Cassani Sorry to disturb you again!
One point I want to make sure:
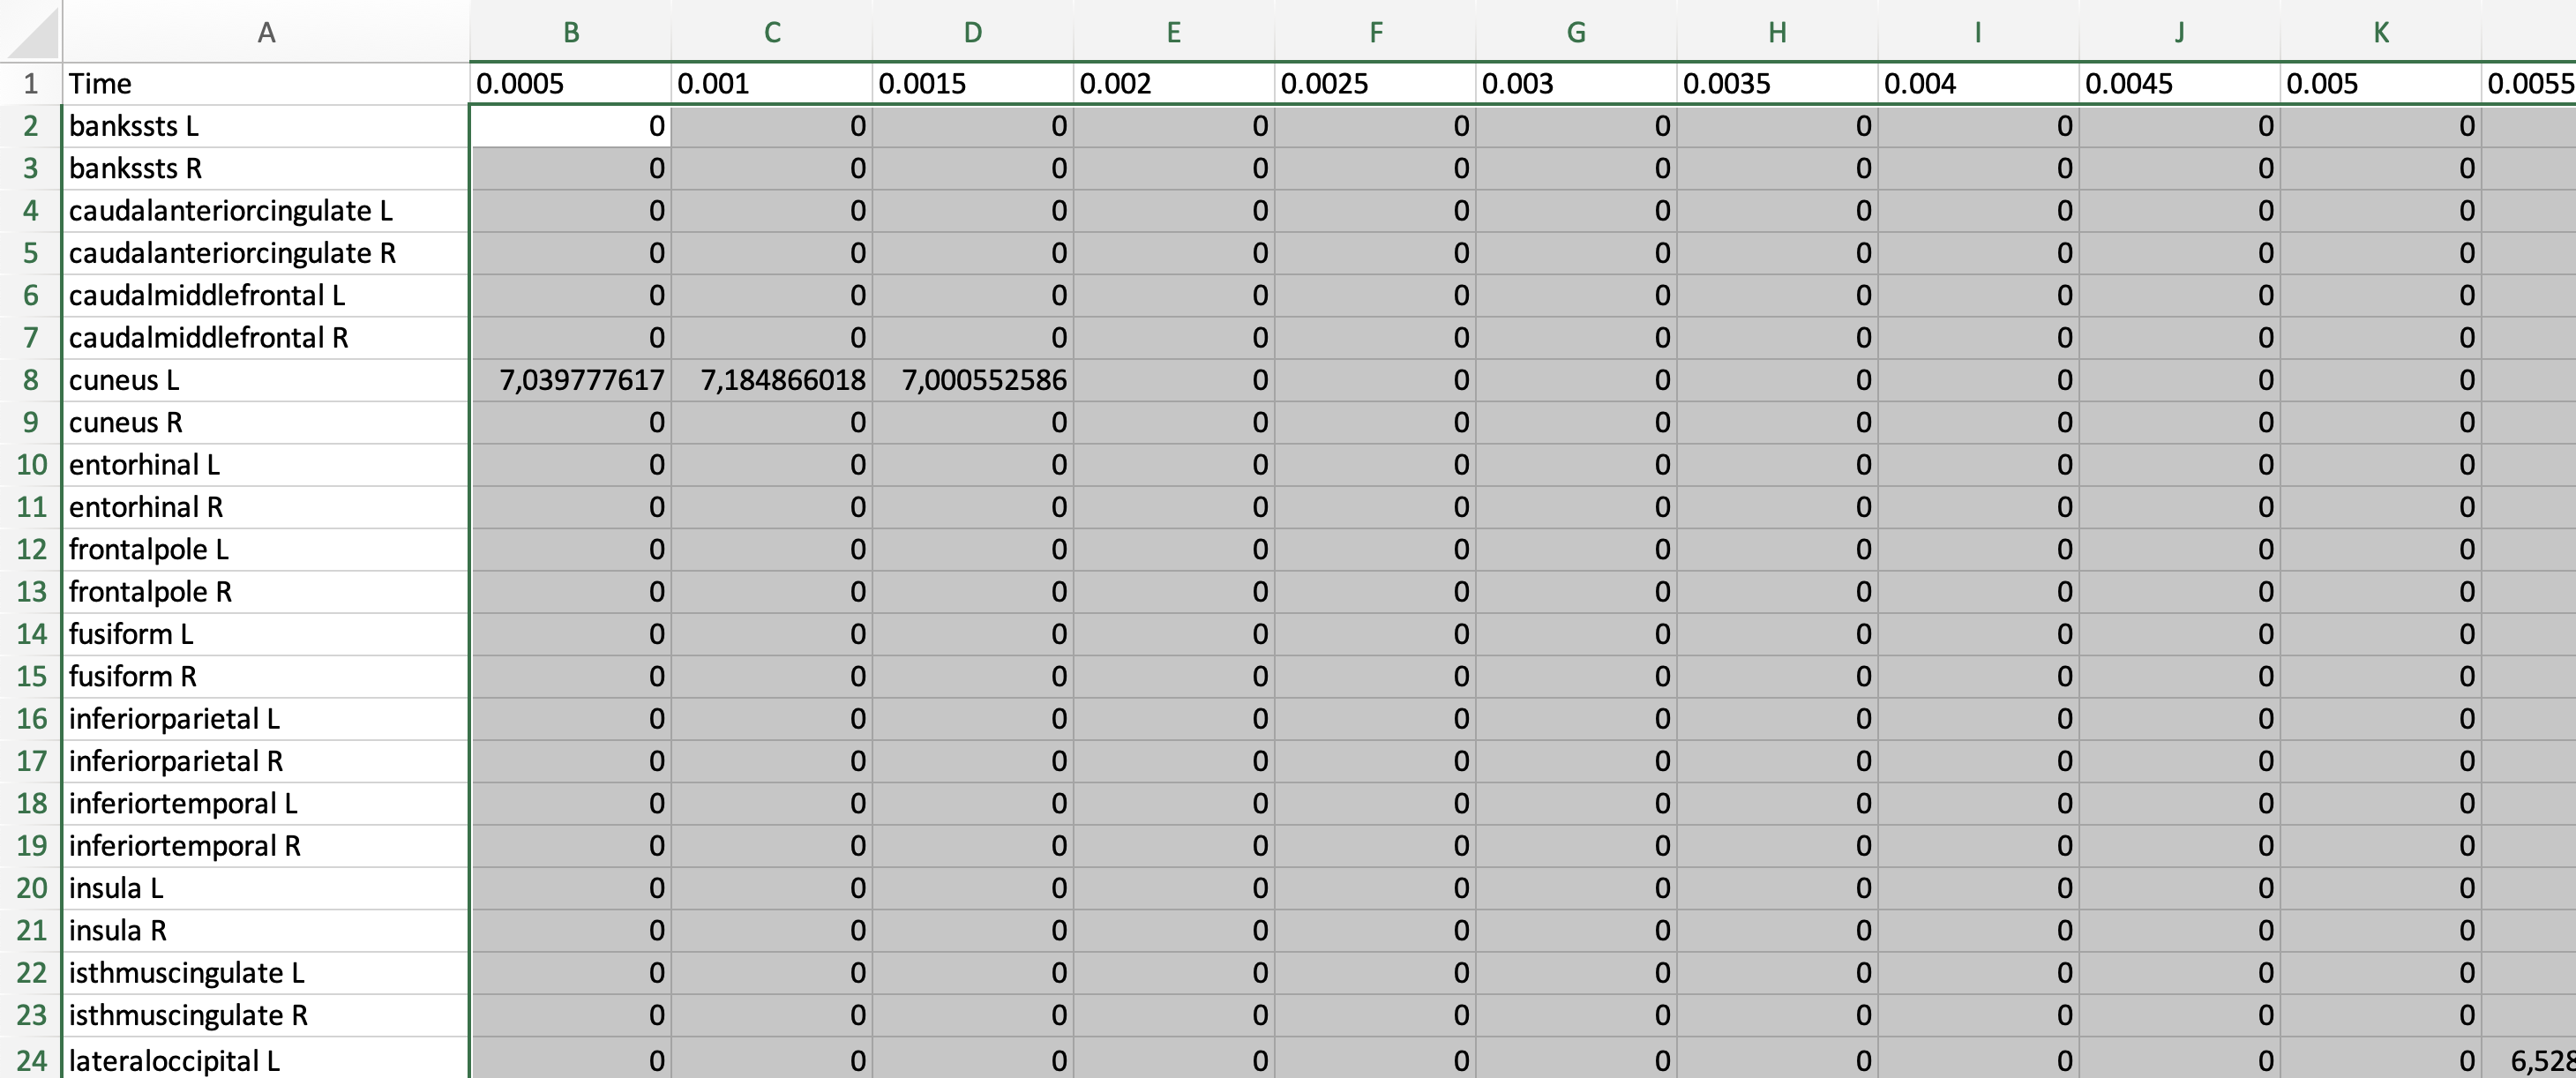
After the Step 2, I got a Excel in which the main body of data looks like statistical value (the grey part in the following screenshot).
My statistic settings are “alpha=0.0001 (Bonferroni:1,2,3)“
Is it means that, the value over 0 in the grey frame suggests statistical significance under my statistic settings?
Looking forward to your reply!