Hi Brainstorm teams,
I hope this message finds you well.
I am exploring the possibility of projecting data(e.g. the number of spikes and HFOs) by each area identified in the DKT atlas using Brainstorm to summarize the result of group analysis. Could you advise whether there is a functionality within Brainstorm that supports this type of presentation?
Thank you for you assistance.
Best regards,
Hi @ADaida,
Simple Scout-wise representations on the cortical surface is in queue for next features:
Meanwhile, if you want to have a 2D plot, you could use tool such as:
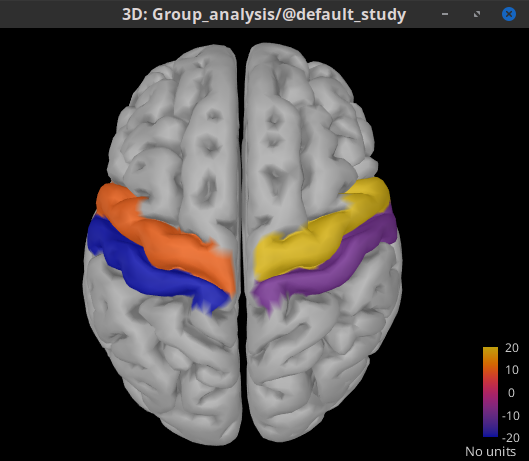
Alternative if you want to have the plots in 3D as with other plots in Brainstorm. It is possible to create a "source" file in which all the sources of a Scout are set to a given value.
Check this code:
which assigns 4 values to 4 scouts from the Desikan-Killiany atlas
Hi Raymundo,
I appreciate for this code!
This is totally what I've wanted.
Thank you very much for your help!
Best,