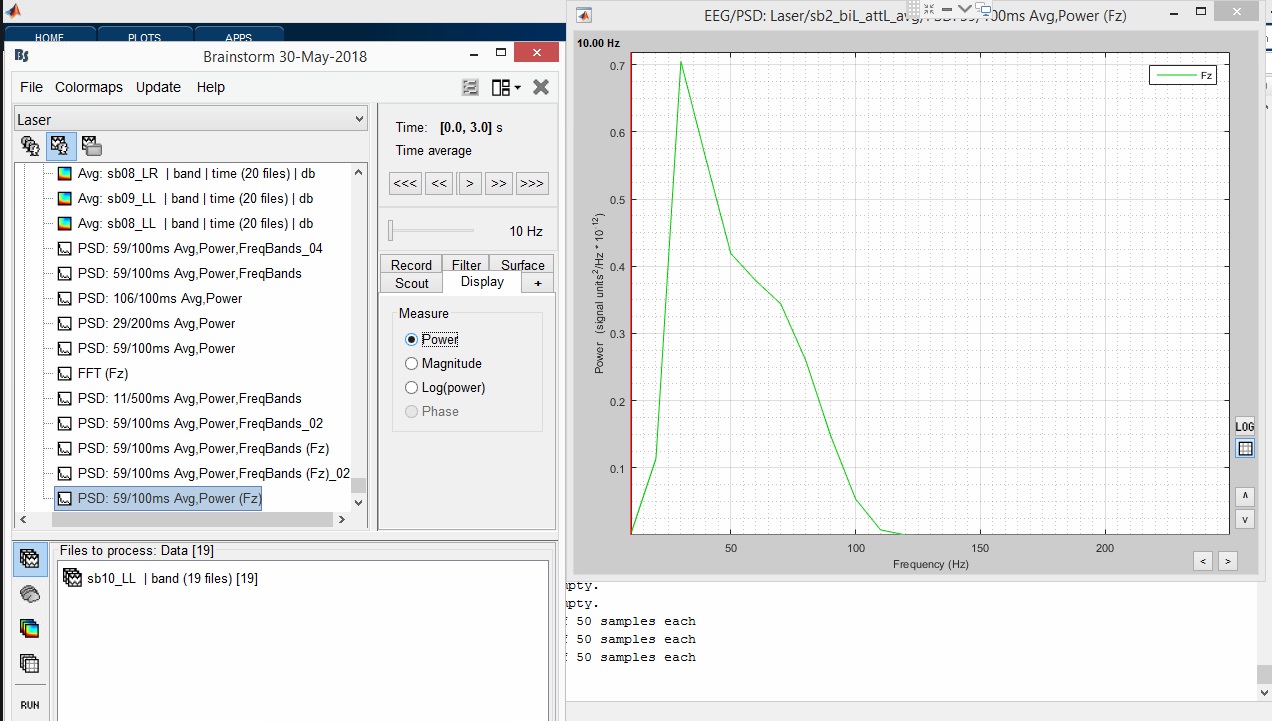
It is the same EEG data as above, it starts from 10 Hz but data is cut at 75 Hz, although data is band pass filtered at 30-100Hz. When I put specific frequency band window, it gives error message.
What does you initial PSD look like? (compute something with an estimator window that is long enough to have a frequency resolution < 1Hz)
The "frequency bands" on the PSD does the following: first it compute the PSD over the entire frequency spectrum as defined by Matlab's FFT function, then it averages the bins contained in each of the frequency bands you requested.
It does this both when using the option "frequency bands" from the PSD process directly, or when using the process "Frequency > Group in time or frequency bands".
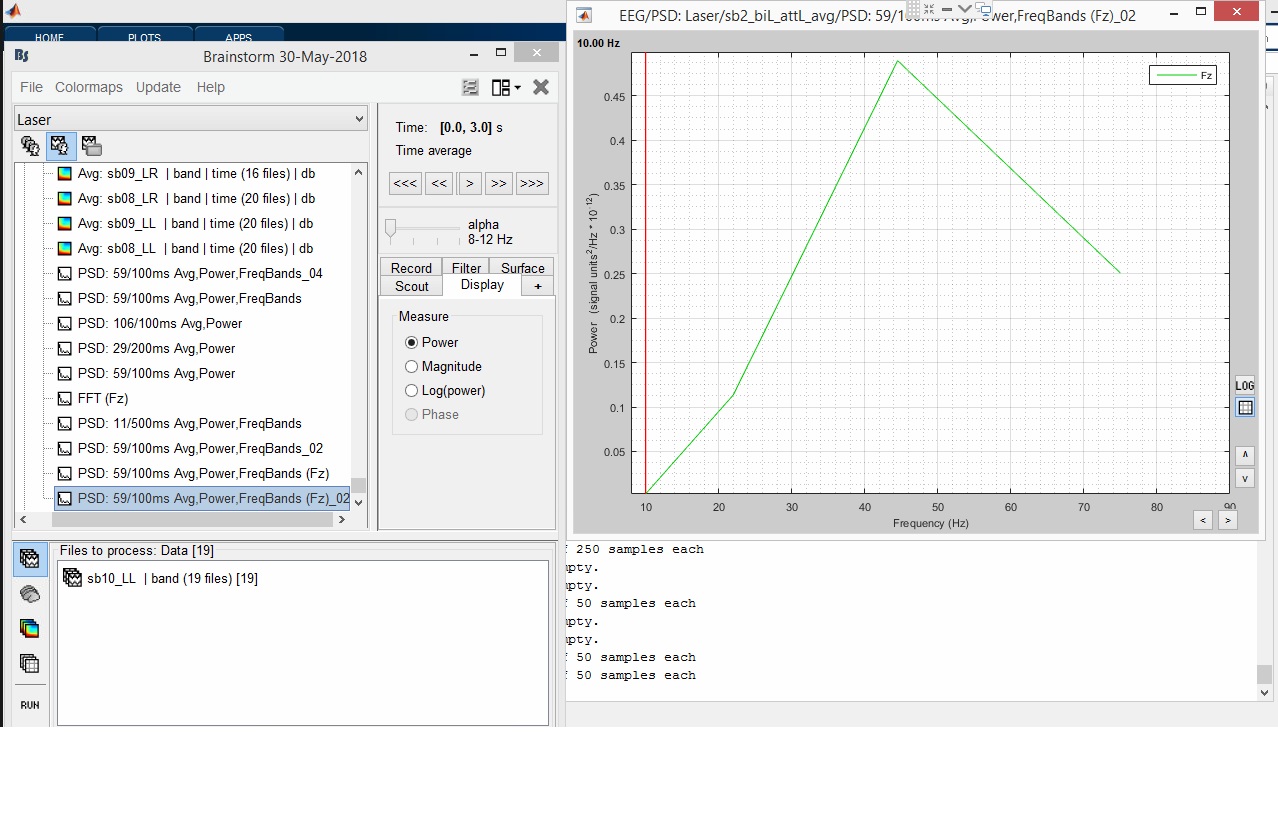
In the spectrum figures, the PSD averaged by frequency bands are represented by one value at the middle of the frequency band, for the band 60-90 you get the averaged value displayed at 75Hz.
It is the same EEG data as above, it starts from 10 Hz but data is cut at 75 Hz, although data is band pass filtered at 30-100Hz. When I put specific frequency band window, it gives error message.
For the calculation of the PSD?
No, it is a fixed-length window for all the frequencies.
You can check out the details of the implementation directly in the code: