Hi
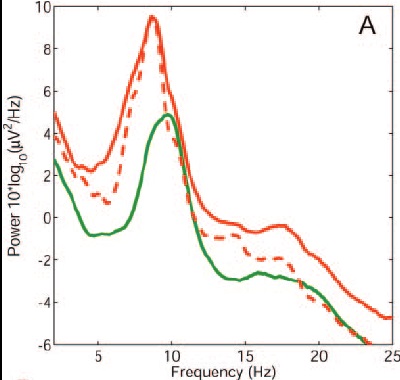
Is it is possible to get log(power^2/hz) transformation for PSD in Brainstorm? Something like that:
Originally, computed PSD is in power^2/hz. Then I go to matlab command, and run Data = log(Data.*10^12). Is it right formula? All values I get are negative. Is the outcome data divided by Hz as in the formula above (log(power^2/hz))?
Can I also convert power to decibel in Brainstorm (db/hz scale)?
Thanks.
For visualization, when a PSD plot is show, select Display Tab > Measure > Log, this will apply 10*log10(), then the PSD will be in [dB/Hz]
In Brainstorm PSDs are stored in [units2/ Hz] with units being volts [V] (or teslas [T]), to change to decibels [dB/Hz], run:
psd_dB = 10 *log10(psd_V);
The negative values that you're seen have their origin in fact that the PSD in [dB/Hz] is computed on the PSD in [V2/Hz].
To have results in the same units as the shared figure, [10*log10(μV2/Hz)]:
- Scale the PSD from [V2/Hz] to [μV2/Hz] by dividing by the squared prefix.
psd_uV = psd_V / (1e-6)^2;
- Then apply 10*log10( )
10*log10(psd_uV)
Thanks Raymundo.
I tried psd_uV = psd_V / (1e-6)^2;
but psd_V was not recognized. How should I define it?
That psd_V variable would be the TF field of the file that was generated with the PSD process.
See this link:
https://neuroimage.usc.edu/brainstorm/Tutorials/ArtifactsFilter/#On_the_hard_drive
True, but I meant a code.
When I run psd_V, matlab does not recognize it (instead Data is recognized, even data is not recognized).
How are you exporting the PSD file to Matlab?
I am trying to do in Brainstorm (pre-processing, matlab command).
Use the command below in the text box. It will scale your PSD from [V2/Hz] to [μV2/Hz]. Then plot the resulting PSD file, and select Log(power) in the Display tab.
% Convert PSD from [V^2/Hz] to [uV^2/Hz]
Data = Data / (1e-6)^2;
Raymundo.Cassani, I wonder if it would be possible to get z score for PSD in Brainstorm ?
I wonder if it would be possible to get z score for PSD in Brainstorm ?
Z-score with respect to what?
The Z-score normalization available in the process "Baseline normalization" estimates the mean and variance computed over a baseline time segment. Your PSD doesn't have any time dimension.
If you want to compute your mean and variance across multiple trials or subjects, you'd need to code this yourself from a Matlab script.
https://neuroimage.usc.edu/brainstorm/Tutorials/Scripting
Thanks Francois.
I mean Z relative to distribution of PSD values across all frequency bands.
e.g. PSD at certain frequency minus mean PSD value from 1 to 100Hz (whole frequency range), divided by standard deviation of PSD value from 1 to 100Hz (whole frequency range).
Does it sound reasonable for doing in Matlab?
Does it sound reasonable for doing in Matlab?
You can easily compute this using the process "Run Matlab command":
https://neuroimage.usc.edu/brainstorm/Tutorials/Scripting#Custom_processing
Whether this measure makes sense or not, or how to interpret it: I don't know, I've never done this myself. Make sure you have good references for justifying its use.
The only PSD normalization documented in the Brainstorm tutorials is the division by the total power:
https://neuroimage.usc.edu/brainstorm/Tutorials/RestingOmega#Power_maps
Hi Niko. That doesn't sound very meaningful to me. The mean power (and std) varies a lot across frequency. So you'd get a spectrum that would look the same, but scaled into this "Z-scores" that cannot be interpreted as usual, e.g. for a statistical threshold.
Cheers
Thanks Marc.Lalancette, got your point.
What about this formula:
PSD value minus mean PSD value across subjects, divided by standard deviation of PSD values across subjects.
That seems like a valid Z-score transformation to me, if that's what you're interested in: how individuals' power values compare with the population distribution. In practice though you don't have the population standard dev (only your sample's), so I believe it's actually a t-statistic.