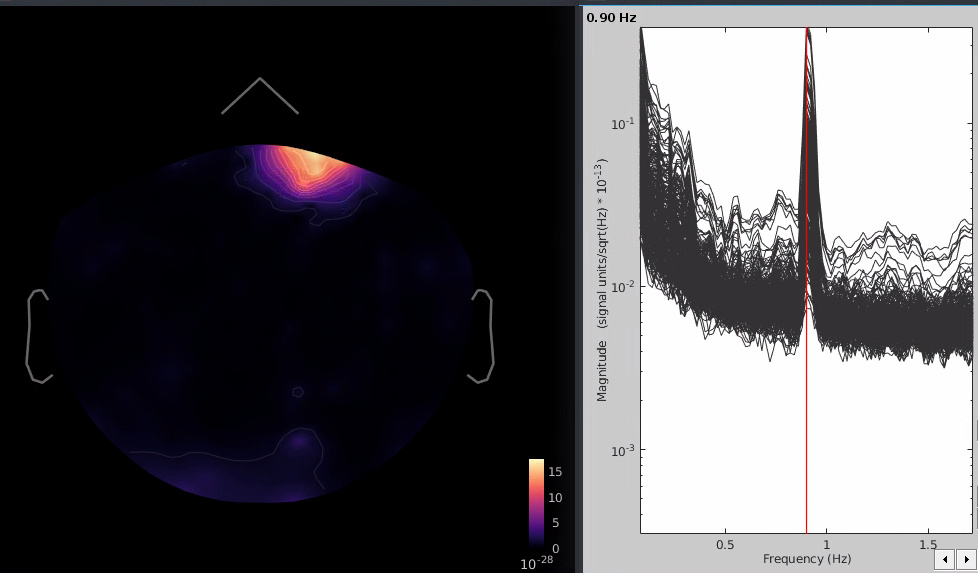
It would be useful to have the log option for the associated topoplot too:
But I think that's a little more complicated.
Edit:
ax = gca;
C = ax.Children(1).FaceVertexCData;
LogC = log10(C);
ax.Children(1).FaceVertexCData = LogC;
caxis('auto')
(or since 2018a: set(gca,'ColorScale','log'))
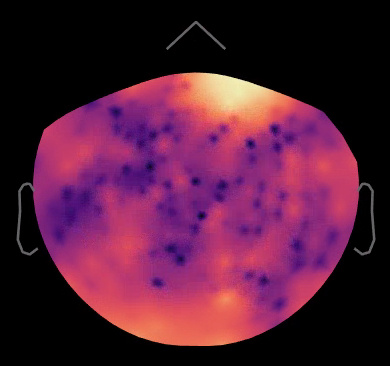
But still have to manually set the ticks and their labels in the color bar.