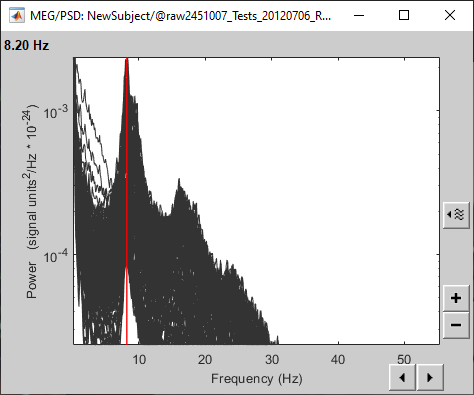
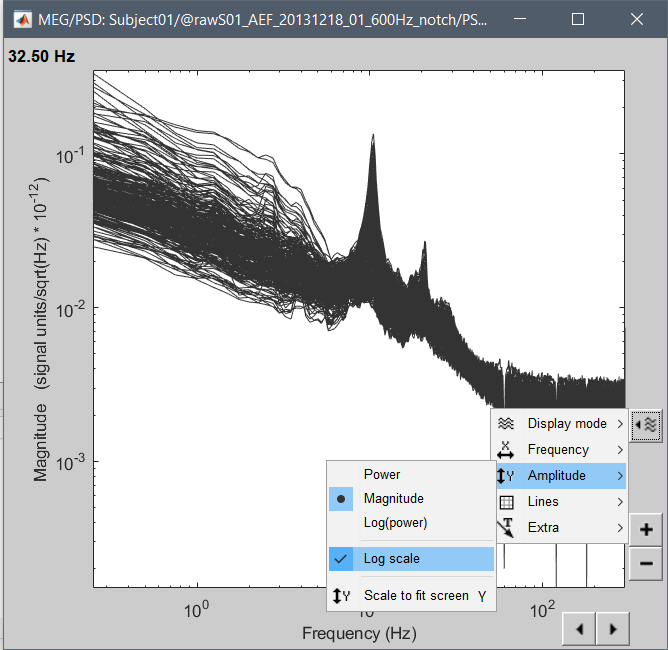
Would it be possible to have an option to toggle the y-axis log/linear like for the x-axis in PSD plots? I'd like to be able to see a log plot with the signal units instead of dB. Would be nice to have the real units in the axis instead of "signal units".
This would require adding and additional parameter to the colormaps: log vs. linear.
And this might not be easy to do...
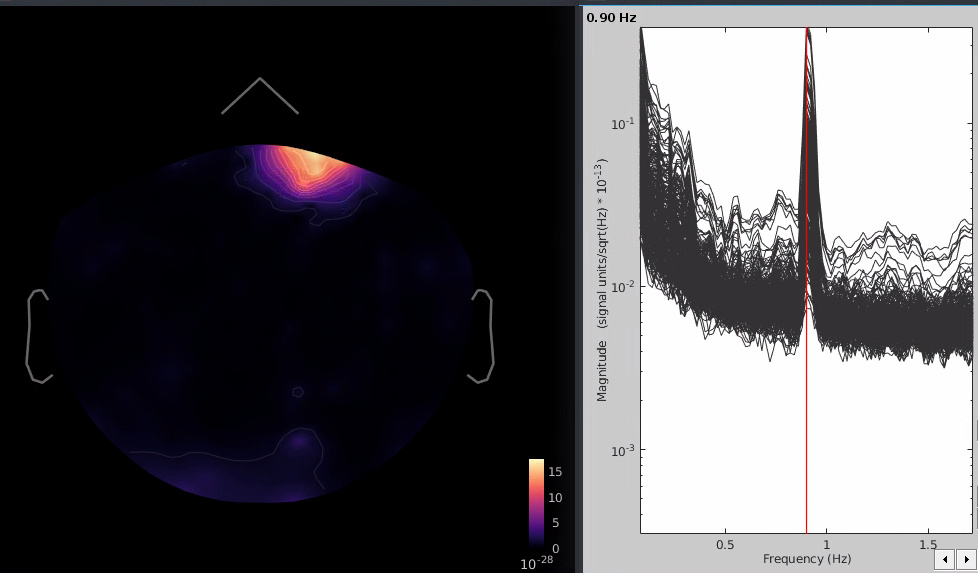
I feel like what you expect from the topo view attached to the log-log PSD graph in signal units is an information of the spatial distribution of the values. You can get this by clicking on the topo figure, and then selecting the option Log(power) in the Display tab. The only "problem" is that the colormap values are in dB instead of signal units.
Is this correct?
But since you have the signal units available in the spectrum figure, all the interesting information is available, I am not convinced it is really worth investing a lot of time developing log-scaled colorbars.
Additionally, it would add to the interface complexity: one more option for the colormaps = two new items log/linear in the colormap menu, while many users are already lost with all the existing options. The less display options the better...
Or am I missing something?
If you think this would be an important feature worth investing time on, could you please illustrate with a few screen captures of the displays you'd like to have vs. the display you currently have with the log(power) option?
Ah, I didn't think of applying the Log(power) option to the topo. That's fine then. However, that display should not apply the "absolute value" setting since the dB values are negative. Otherwise the color map is flipped.
A note on the PSD y-scale log: middle button dragging along y doesn't work too well. It tends to "jump", e.g. == >
This is more obvious with power than amplitude.
Finally, I'm not sure why, but you can't pan up or down (middle drag) until you've rescaled a bit (right drag up). Also, if you scale down (right drag down) and then attempt to pan, it rescales to the default scale. Not sure if that's intentional.
However, that display should not apply the "absolute value" setting since the dB values are negative. Otherwise the color map is flipped.
Indeed, but I don't want to add some code that changes automatically the colormap configuration. This would be difficult to track from the user, and colormap changes are permanent, not only relative to one figure (the colormap management is centralized, so that figures of the same type are all represented in the same way). This would alter the display of other figures (eg. time-frequency maps) without explicit control of the user.
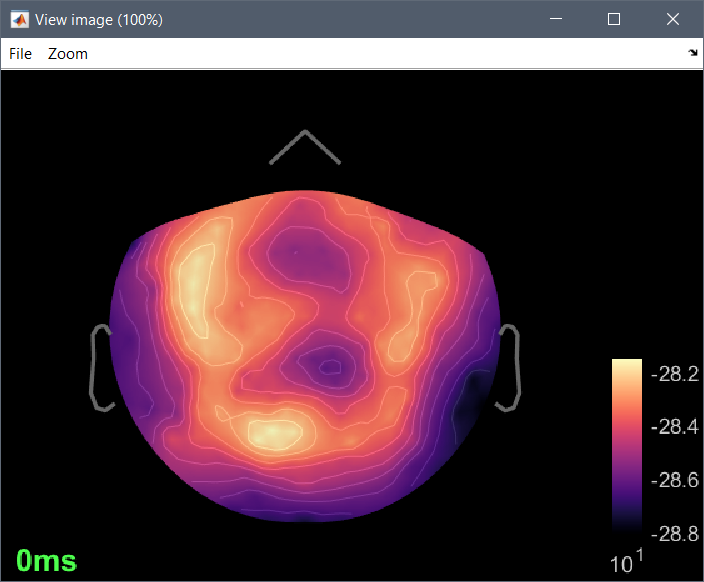
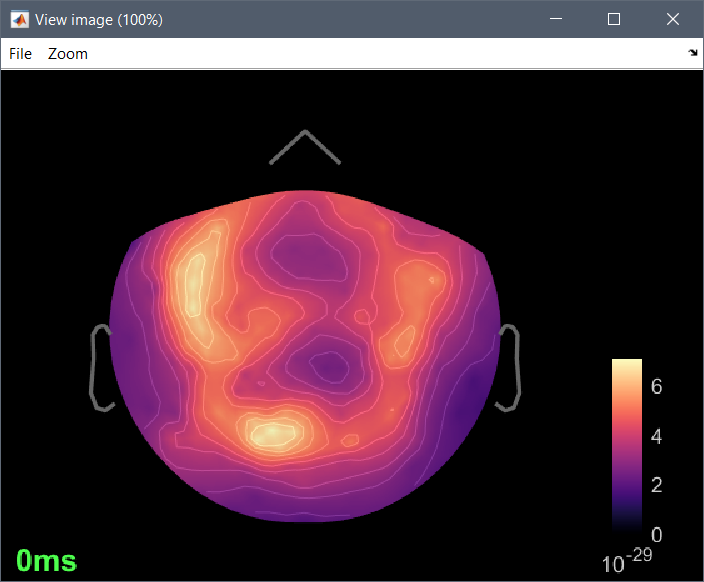
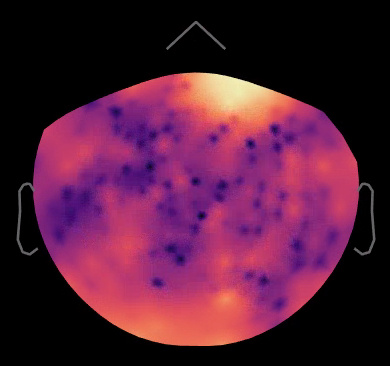
The log-scaled topography are a bit more contrasted, but not more informative than the power maps. The only thing that changes is the values in the colorbar. Below: left=log, right=power.
Since this is something that very few people would use, and mostly experts who know what they are doing, I don't want to add more complexity to the interface or invest a lot of development time to have colormaps defined at the level of the figure.
Conclusion: If you change the topography to log values, you also need to manually change the colormap configuration to "relative".
Does this seem reasonable to you?
Finally, I'm not sure why, but you can't pan up or down (middle drag) until you've rescaled a bit (right drag up). Also, if you scale down (right drag down) and then attempt to pan, it rescales to the default scale.
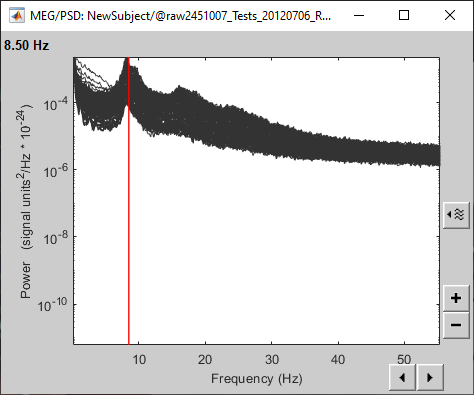
Panning should be limited to the maxima detect for the figure, so that you can't move your graph freely to places where there is no data. The problem mentioned above is related to the fact that the initial max scale (YLimInit) is not set correctly to the actual maximal values. Indeed, for the power and magnitude plots, it sets the maximum to the second peak in the graph (otherwise, the scale is graph is usually unusable). For the log-scaled, it uses now the actual maxima, which will allow you to pan to anywhere there is data.
This commit should fix the log-scaled Y axis:
Are you satisfied with this?
A note on the PSD y-scale log: middle button dragging along y doesn't work too well. It tends to "jump",
Indeed, panning in log-scaled axes is a bit complicated...
If you think this is an important feature, I'll let you suggest an improvement solution.
It happens in figure_spectrum.m, lines 287-302.
To see better what is happening, you could try adding something like
            % Get figure configuration
            TsInfo = getappdata(hFig, 'TsInfo');
            % If log-scale: adjust figure motion
            if strcmpi(TsInfo.XScale, 'log')
                motionFigure(1) = motionFigure(1) / 10;
            end
            if strcmpi(TsInfo.YScale, 'log')
                motionFigure(2) = motionFigure(2) / 10;
            end
But now the maximum scale is fixed, you should have less to pan, so maybe this is less of a problem...
In your example yes, but look at the example I posted before. Log reveals the whole pattern whereas power only shows the very strong frontal cluster.
Yes that's fine.
Well... since panning doesn't really work, it didn't really help.
This isn't the case when expanding the scale.
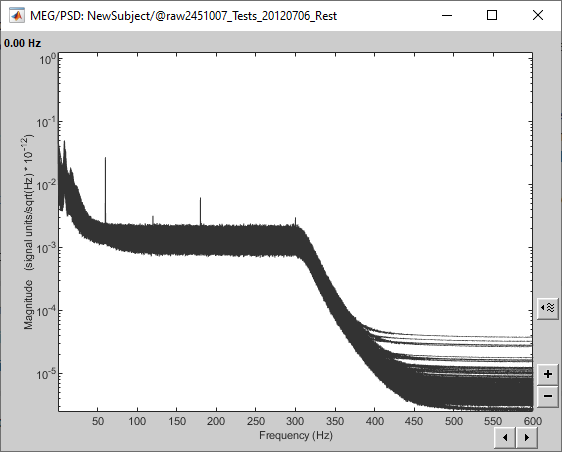
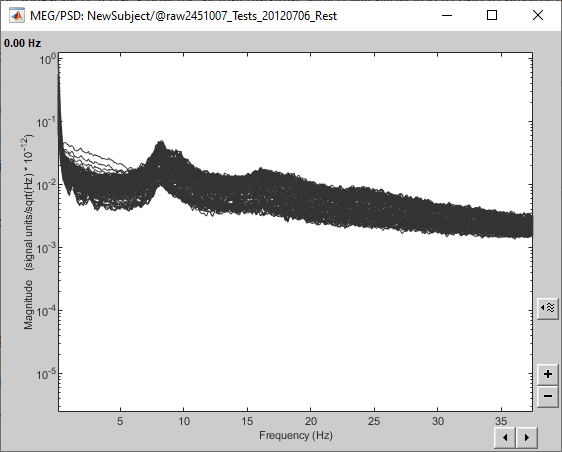
The simple thing I was trying to do is to be able to zoom in on low frequencies (below the filter drop) and see it expanded to the whole y-scale. For now this is what happens:
Full spectrum
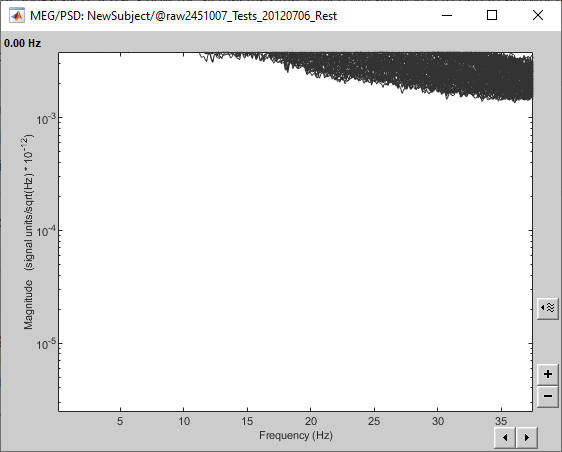
Zoom x (ok)
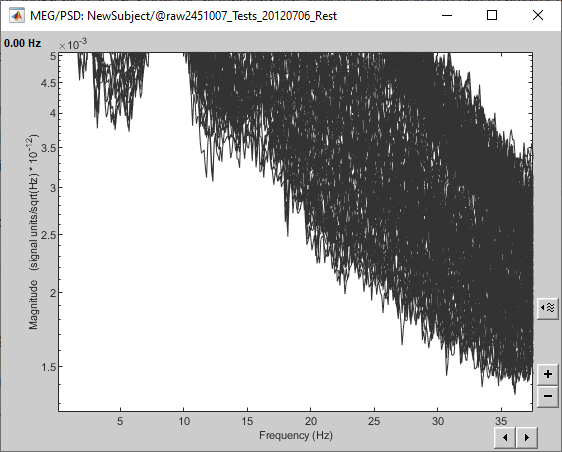
Zoom y
"Pan" down
Thanks for the code pointer. I'll add this to my to-do list.
I just ran into a related issue: On the topo figure, snapshot, save as SSP projector. When displaying power or log, it saves these values and not the underlying amplitudes. Edit: I was thinking the amplitudes were the only sensible option for projectors, but even those aren't really appropriate since they're all positive and ignore phases... so never mind.
P.S. "Save as SSP projector" doesn't remember the last used folder. It always goes to my home folder.
I was thinking the amplitudes were the only sensible option for projectors, but even those aren't really appropriate since they're all positive and ignore phases... so never mind.


 == >
== >