Hi Team,
For my analysis, all subjects have individual MRIs. I am using group template grid for all my subjects with 1 cm resolution to compare across all the subjects as forward head model and have 1645 grid points. I used (dSPM-unconstrained, unscaled) to compute the inverse model.
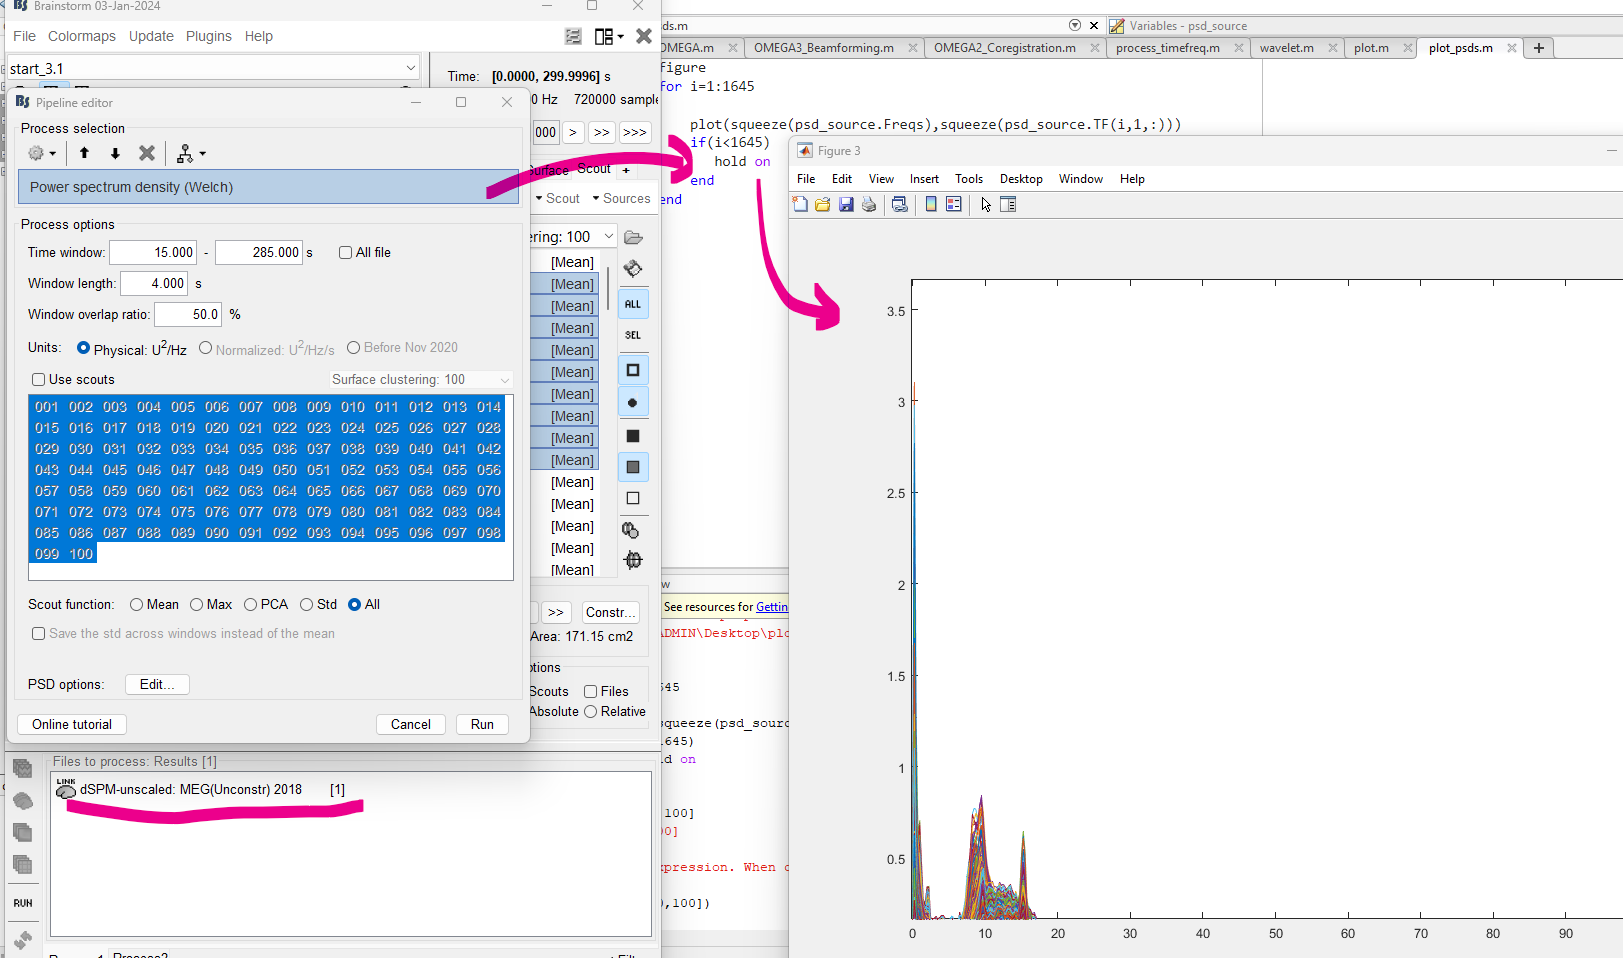
I computed PSD of source signals using the below config and exported the data to matlab as I couldn't see a 2d PSD plot but instead in the MRI space.
Upon plotting the PSD of each grid point source, I observe 1/f characteristics and some peaks similar to the original MEG sensor data's PSD. Can you let me know, if I calculated the PSD of source data correctly? Should the source data PSD have the observed characteristics ?
Hello,
This looks fine. I note that you have not ticked the Use-Scouts checkbox, which means that you have obtained 1645 PSD spectra. If this was your intention, then things look fine. Note also you should be able to visualize these values in Brainstorm as a graph: what happens when you right-click over the resulting PSD file?
Yes Sylvain - I wanted grid specific source spectra
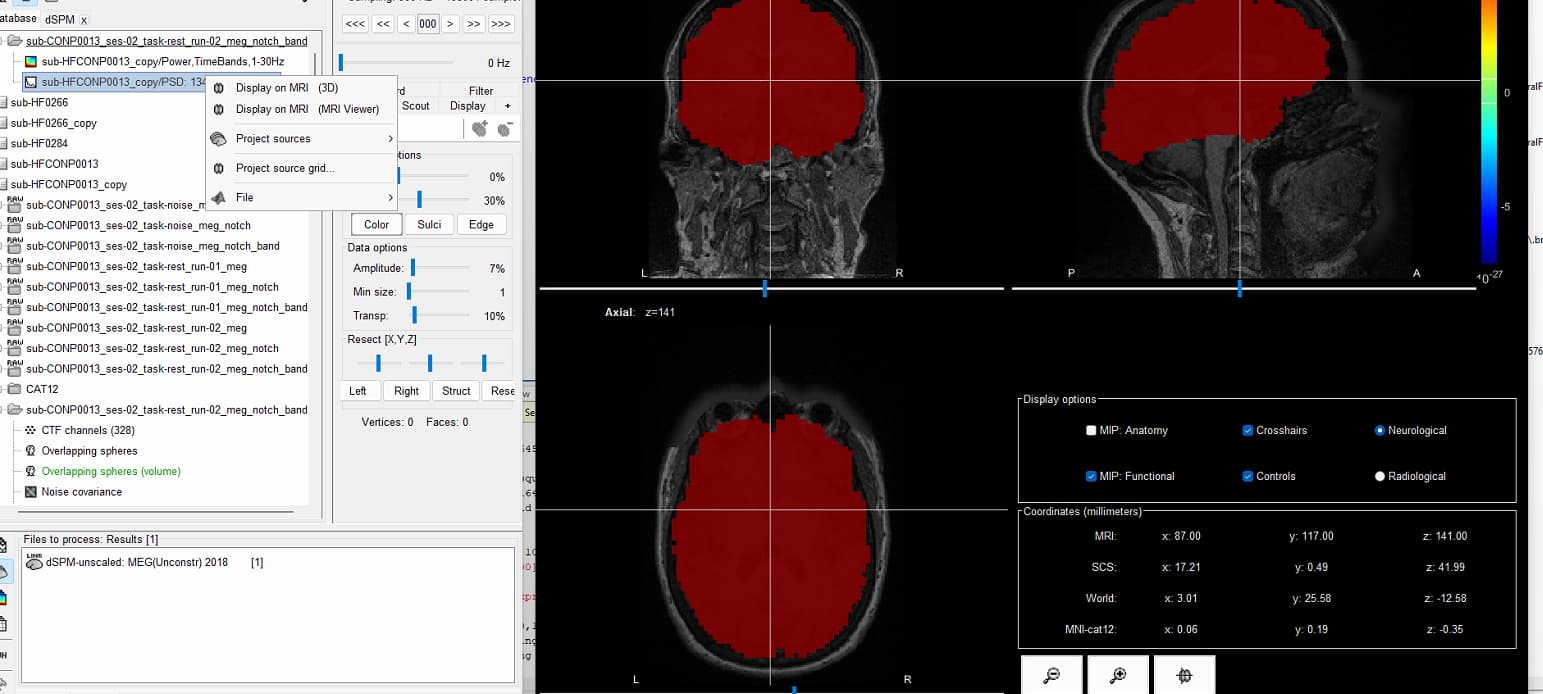
I don't see option for a graph.
Also, my goal is to analyse TF plots of the source data. What would your advice be for choosing Morlet Wavelet transformation over Multi-taper (mtmconvol of fieldtrip)?
I see. Maybe the logic is that it would be too many traces at once, hence unpractical.
Try defining a scout region of interest in the MR and then extract the regional PSD from there.
Yes - I was able to see PSD graph of scouts by running the following config:
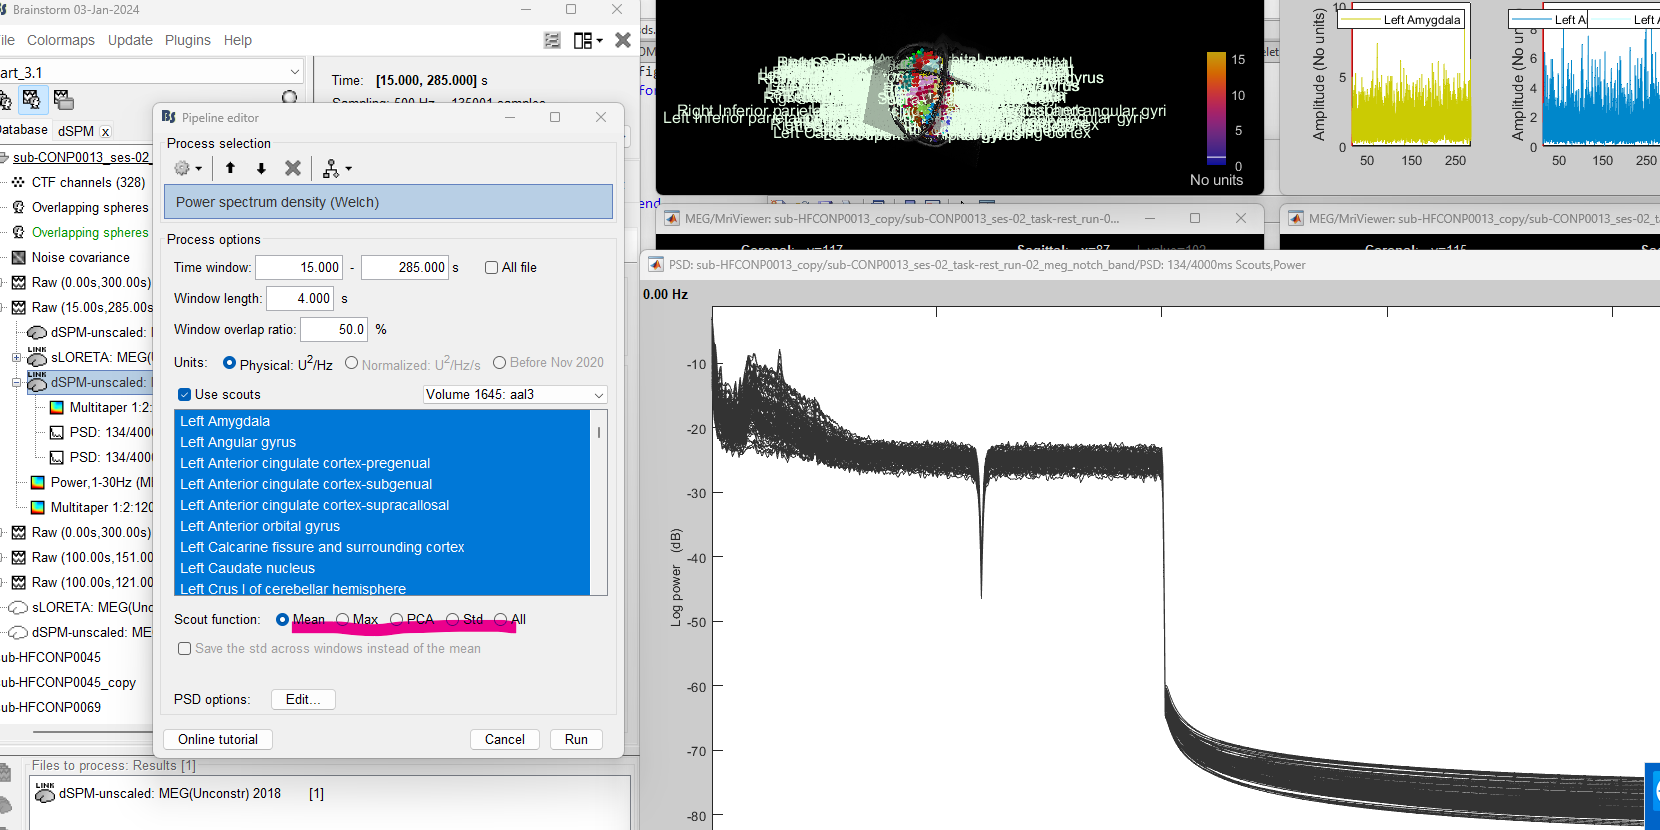
- Can you help me understand what are the 4 options of scout functions for ?
- Also, my goal is to analyse TF plots of the source data. What would your advice be for choosing Morlet Wavelet transformation over Multi-taper (mtmconvol of fieldtrip)?
Thanks
Please consult the documentation about Scout functions.
As for selecting the TF method, there is no generic answer as it all depends on your scientific question. I encourage you to replicate some of the approaches documented in papers in your field.
This helps! Thank you!!
1 Like
Hello Experts!
I couldn't figure out how change the source/channel number to visualise each grid source's TF plot.
I am using group template grid for all my subjects with 1 cm resolution to compare across all the subjects as forward head model and have 1645 grid points. I used (dSPM-unconstrained, unscaled) to compute the inverse model. I computed PSD of source signals.
Also, I exported the TF to matlab as seen below:

I am struggling to understand and verify if grid source 1 (i.e. rownames) of one subject will be at the same brain location for other subject. I want to compare the TF plots at each source location amongst different subjects. Thus, I wanted to check if my insights for source X's TF comparison will be referring to the same anatomical location for all the subjects. Can you please confirm ?
Thanks!
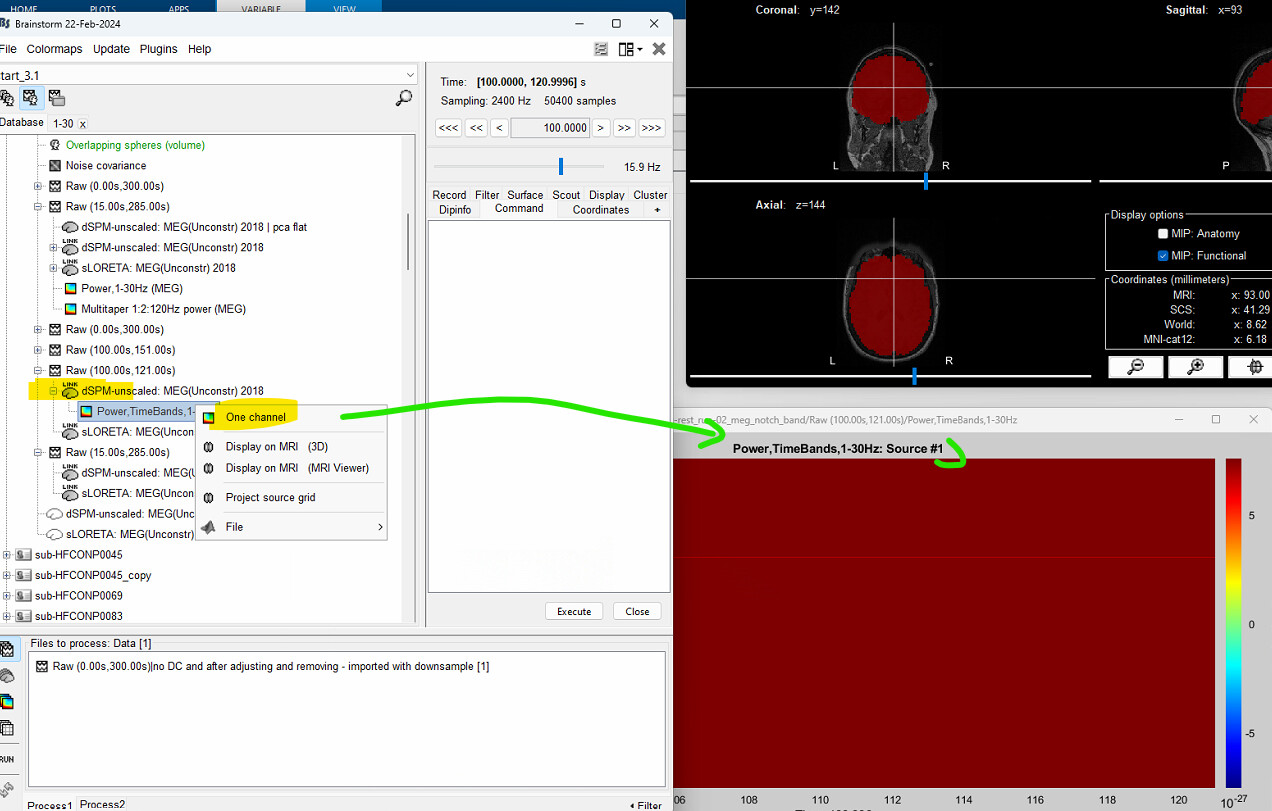
This option is not available when displaying time-frequency maps computed for each vertex. The reason behind is that often there are thousands of sources in the menu. If you want to get the TF for an specific source you can either:
-
Open the TF file on the cortex, right-click on the desired source and plot it TF map, as shown in:
https://neuroimage.usc.edu/brainstorm/Tutorials/TimeFrequency#Full_cortical_maps -
Manually change the vertex that is displayed on the One channel TF map. With the TF map as current figure you could run this in Matlab
% Get handler for TF figure
hFigTf = gcf;
% Get TF info from figure
TfInfo = getappdata(hFigTf, 'Timefreq');
% Ask to plot source 5
TfInfo.RowName = '5';
% Set TF info in figure
setappdata(hFigTf, 'Timefreq', a);
% Update figure to show changes
figure_timefreq('UpdateFigurePlot', hFigTf, 1)
If you are using a template grid for group analsisfor Subject 1 and Subject 2:
- The grid have the same number and,
- Source 1 for Subject 1 will have the same MNI coordinates that Source 1 for Subject 2
https://neuroimage.usc.edu/brainstorm/Tutorials/CoregisterSubjects#Volume_source_models
1 Like
Thank you so much for your guidance!